Springfield: Fire Incidents, Michigan (MI)
Where are fire incidents reported in Springfield, MI
Something went wrong! Please refresh the page.
|
| |||||||||||||||||||||||||||||||||||||||||||||||||||||||||||||||||||||||||||||||||||||||||||||||||||||||||||||
2002 - 2018 National Fire Incident Reporting System (NFIRS) incidents
- Incident types reported to NFIRS in Springfield, MI
- 74546.5%Rescue & EMS
- 39624.7%Good Intent Call
- 22313.9%Fire
- 905.6%Hazardous Condition
- 754.7%False Alarm
- 704.4%Service Call
- 20.1%Special Incident
- Fire incident types reported to NFIRS in Springfield, MI
- 11852.9%Structure Fires
- 4620.6%Mobile Property/Vehicle Fires
- 3013.5%Outside Fires
- 2913.0%Other
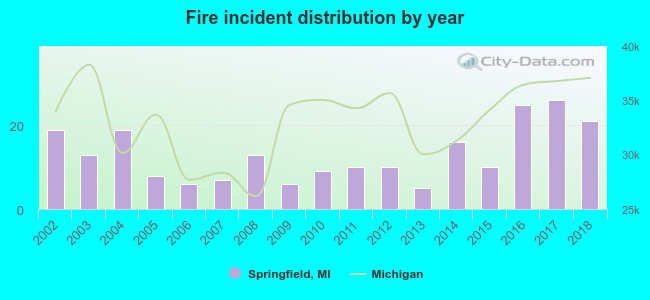 According to the data from the years 2002 - 2018 the average number of fire incidents per year is 13. The highest number of fires - 26 took place in 2017, and the least - 5 in 2013. The data has an increasing trend.
The average number of yearly fire incidents per 10k residents in Springfield, MI compared to nearest cities:
(Note: Based on data for the last 3 years, including only cities with population 5,000 and above)
| Springfield: | 46.1 |
| Battle Creek: | 54.7 |
| Marshall: | 75.8 |
| Kalamazoo: | 79.9 |
| Portage: | 23.9 |
| Hastings: | 89.5 |
| Albion: | 93.5 |
| Charlotte: | 81.7 |
| Coldwater: | 70.3 |

 38.6% incidents where reported in the morning and 61.4% in the evening. The most fires (19.3%) took place on Tuesday, and the least (10.3%) on Thursday.
 According to the 223 fire incident reports from years 2002 - 2018 most fires (12.6%) took place during May, and the least (3.6%) in August.
 Out of all 1,602 cases reported during the years 2002 - 2018, the most belonged to the categories: Rescue & EMS (46.5%), Good Intent Call (24.7%), and Fire (13.9%).
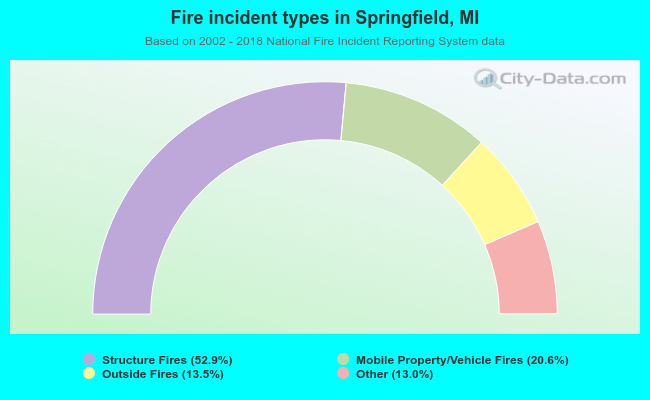 When looking into fire subcategories, the most reports belonged to: Structure Fires (52.9%), and Mobile Property/Vehicle Fires (20.6%).