South Pasadena: Fire Incidents, Florida (FL)
Where are fire incidents reported in South Pasadena, FL
Something went wrong! Please refresh the page.
|
| |||||||||||||||||||||||||||||||||||||||||||||||||||||||||||||||||||||||||||||||||||||||||||||||||||||||||||||
2005 - 2018 National Fire Incident Reporting System (NFIRS) incidents
- Incident types reported to NFIRS in South Pasadena, FL
- 8,35876.3%Rescue & EMS
- 1,44713.2%Good Intent Call
- 4133.8%Fire
- 3713.4%Hazardous Condition
- 2882.6%False Alarm
- 680.6%Service Call
- Fire incident types reported to NFIRS in South Pasadena, FL
- 21151.1%Structure Fires
- 8921.5%Outside Fires
- 6816.5%Mobile Property/Vehicle Fires
- 4510.9%Other
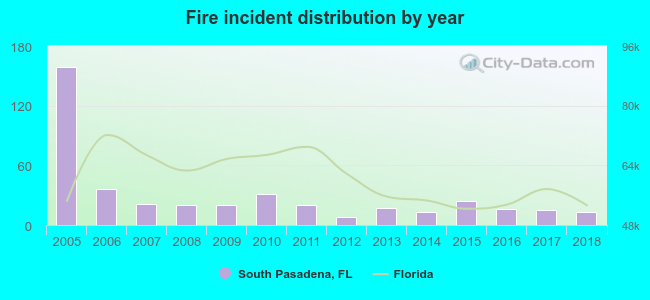 Based on the data from the years 2005 - 2018 the average number of fires per year is 30. The highest number of fire incidents - 159 took place in 2005, and the least - 8 in 2012. The data has a declining trend.
The average number of yearly fire incidents per 10k residents in South Pasadena, FL compared to nearest cities:
(Note: Based on data for the last 3 years, including only cities with population 5,000 and above)
| South Pasadena: | 29.1 |
| Gulfport: | 23.5 |
| Treasure Island: | 29.9 |
| Kenneth City: | 6.6 |
| Lealman: | 15.8 |
| Seminole: | 58.6 |
| Pinellas Park: | 38.7 |
| Largo: | 32.8 |
| Clearwater: | 44.1 |

 Based on the data from the years 2005 - 2018 the average number of fire-related casualties per year is 1. The highest number of reported injuries - 4 took place in 2005, and the lowest - 0 in 2006. The data has a declining trend.
 33.7% incidents where reported in the morning and 66.3% in the evening. The most fires (16.7%) took place on Saturday, and the least (11.9%) on Wednesday.
 According to the 413 fire incidents from years 2005 - 2018 most fires (15.5%) took place during April, and the least (3.9%) in November.
 Out of all 10,956 cases reported during the years 2005 - 2018, the most belonged to the categories: Rescue & EMS (76.3%), Good Intent Call (13.2%), and Fire (3.8%).
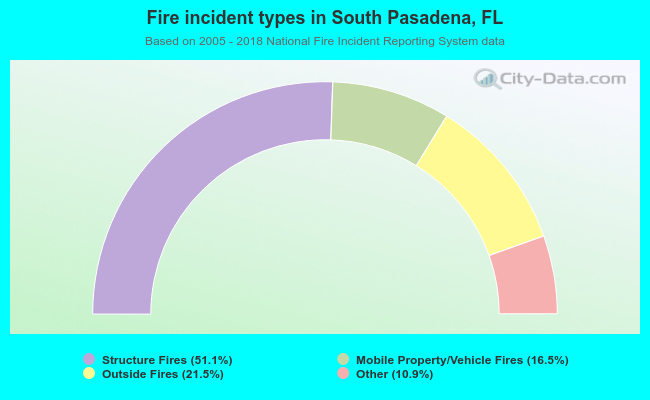 When looking into fire subcategories, the most incidents belonged to: Structure Fires (51.1%), and Outside Fires (21.5%).