South Hill: Fire Incidents, Virginia (VA)
Where are fire incidents reported in South Hill, VA
Something went wrong! Please refresh the page.
| Fire incidents reported | |
|---|---|
| Sreet name | Count |
| INTERSTATE 85 | 318 |
| HIGHWAY ONE | 178 |
| ATLANTIC ST | 176 |
| MECKLENBURG AVE | 90 |
| GOODES FERRY RD | 86 |
| PLANK RD | 76 |
| HIGHWAY 58 | 72 |
| CIRCLE DR | 66 |
| HIGHWAY 47 | 60 |
| BASKERVILLE RD | 52 |
| DANVILLE ST | 52 |
| CHAPTICO RD | 50 |
| HIGHWAY 903 | 46 |
| POWELL DR | 46 |
| ALTANTIC ST | 38 |
| REDLAWN RD | 38 |
| BUENA VISTA CIR | 36 |
| MAIN ST | 36 |
| FERRELL ST | 34 |
| UNION MILL RD | 34 |
| BELFIELD RD | 32 |
| CRAIG MILL RD | 30 |
| HALIFAX ST | 30 |
| LOCUST ST | 28 |
| PARK VIEW CIR | 28 |
| UNION LEVEL RD | 28 |
| ALPINE RD | 26 |
| FRANKLIN ST | 26 |
| ROCKY BRANCH RD | 26 |
| LOMBARDY ST | 24 |
| Other | 44 |
2002 - 2018 National Fire Incident Reporting System (NFIRS) incidents
- Incident types reported to NFIRS in South Hill, VA
- 3,80452.7%Hazardous Condition
- 1,90626.4%Fire
- 6659.2%Good Intent Call
- 4746.6%False Alarm
- 1862.6%Rescue & EMS
- 1041.4%Service Call
- 620.9%Severe Weather
- 80.1%Special Incident
- Fire incident types reported to NFIRS in South Hill, VA
- 1,02053.5%Structure Fires
- 50526.5%Outside Fires
- 35818.8%Mobile Property/Vehicle Fires
- 231.2%Other
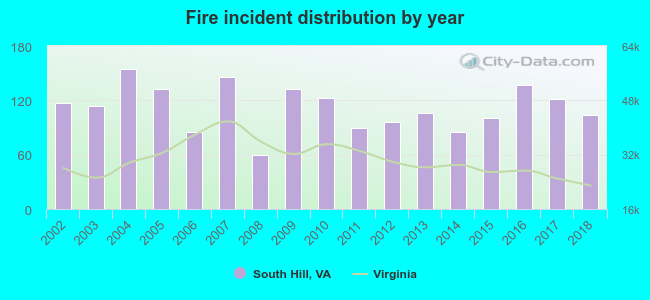 Based on the data from the years 2002 - 2018 the average number of fires per year is 112. The highest number of reported fire incidents - 155 took place in 2004, and the least - 60 in 2008. The data has a declining trend.
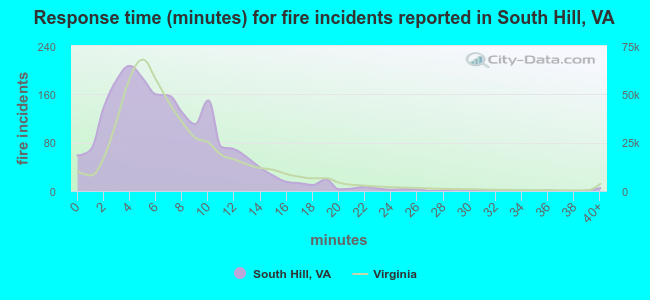 The median response time based on all reported fire incidents is 6 minutes. This is close to the state median value.
The median response time in South Hill, VA compared to nearest cities:
(Note: Based on data for all years, including only cities with at least 500 fire incidents)
| South Hill: | 6 minutes |
| Boydton: | 8 minutes |
| Lawrenceville: | 12 minutes |
| Chase City: | 8 minutes |
| Littleton: | 9 minutes |
| Clarksville: | 10 minutes |
| Blackstone: | 9 minutes |
| Henderson: | 6 minutes |
| Roanoke Rapids: | 5 minutes |
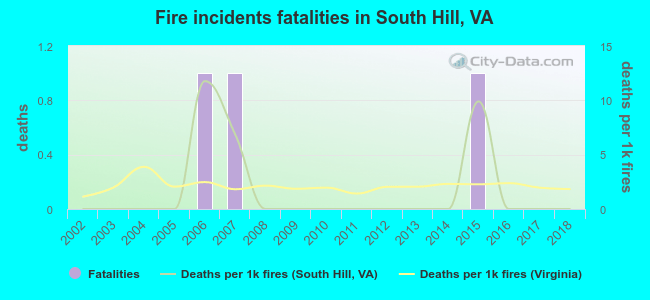 According to the data from the years 2002 - 2018 the average number of fire-related yearly deaths is 0. The highest number of reported deaths - 1 took place in 2006, and the lowest - 0 in 2002. The data has a constant trend.
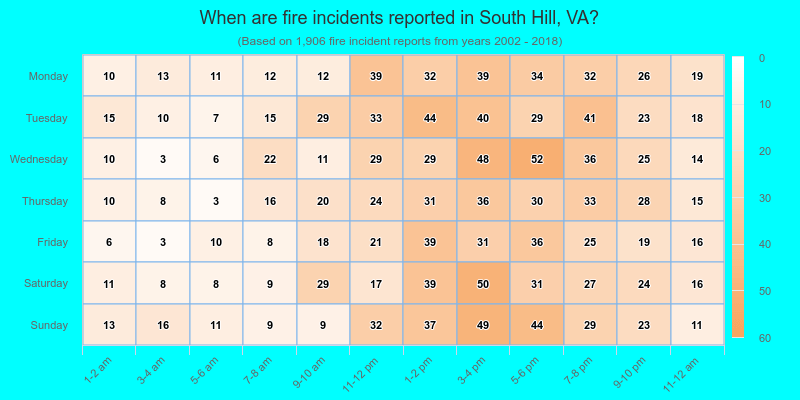
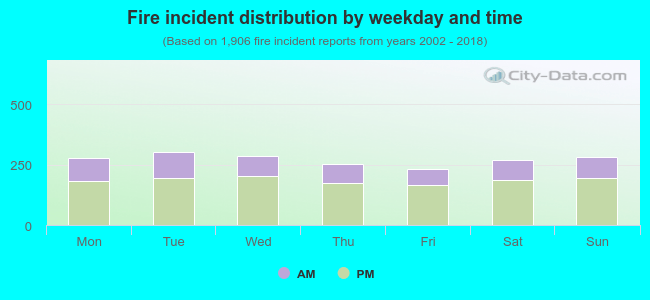 31.8% incidents where reported in the morning and 68.2% in the evening. The most fires (15.9%) took place on Tuesday, and the least (12.2%) on Friday.
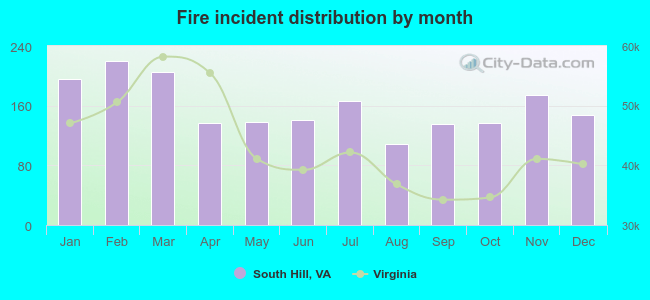 According to the 1,906 incident reports from years 2002 - 2018 most fires (11.5%) took place during February, and the least (5.7%) in August.
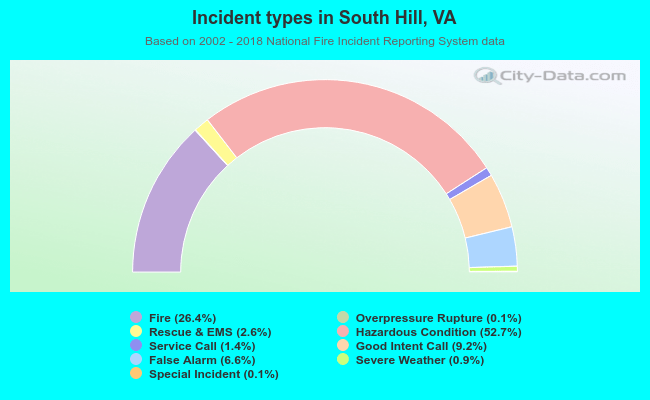 Out of all 7,216 cases reported during the years 2002 - 2018, the most belonged to the categories: Hazardous Condition (52.7%), Fire (26.4%), and Good Intent Call (9.2%).
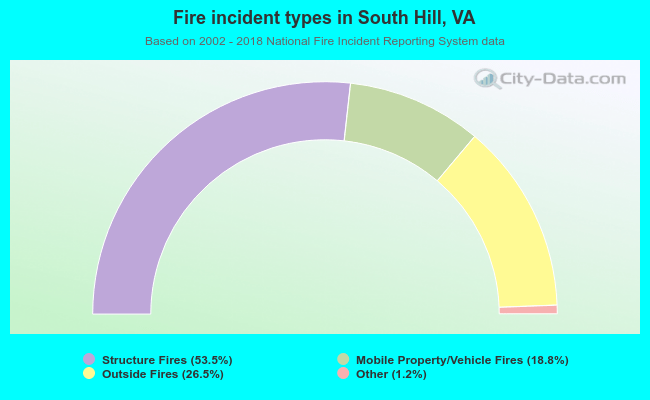 When looking into fire subcategories, the most reports belonged to: Structure Fires (53.5%), and Outside Fires (26.5%).