South Bay: Fire Incidents, Florida (FL)
Where are fire incidents reported in South Bay, FL
Something went wrong! Please refresh the page.
|
| |||||||||||||||||||||||||||||||||||||||||||||||||||||||||||||||||||||||||||||||||||||||||||||||||||||||||||||
2002 - 2018 National Fire Incident Reporting System (NFIRS) incidents
- Incident types reported to NFIRS in South Bay, FL
- 1,49162.5%Rescue & EMS
- 31913.4%Fire
- 2068.6%Good Intent Call
- 1948.1%Hazardous Condition
- 1255.2%False Alarm
- 421.8%Service Call
- 50.2%Special Incident
- Fire incident types reported to NFIRS in South Bay, FL
- 15648.9%Outside Fires
- 8827.6%Structure Fires
- 6821.3%Mobile Property/Vehicle Fires
- 72.2%Other
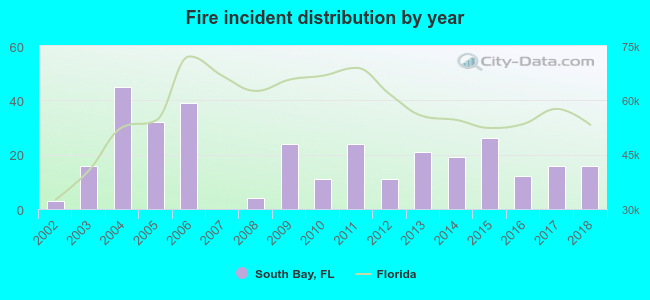 Based on the data from the years 2002 - 2018 the average number of fires per year is 19. The highest number of fire incidents - 45 took place in 2004, and the least - 0 in 2007. The data has a rising trend.
The average number of yearly fire incidents per 10k residents in South Bay, FL compared to nearest cities:
(Note: Based on data for the last 3 years, including only cities with population 5,000 and above)
| South Bay: | 29.2 |
| Belle Glade: | 30.5 |
| Pahokee: | 36.5 |
| Clewiston: | 226.9 |
| Glades: | 0.5 |
| Wellington: | 8.3 |
| Indiantown: | 54.2 |
| Royal Palm Beach: | 11.2 |
| Greenacres: | 14.3 |

 Based on the data from the years 2002 - 2018 the average number of fire-related casualties per year is 0. The highest number of reported injuries - 2 took place in 2008, and the lowest - 0 in 2002. The data has a constant trend.
 33.9% incidents where reported in the morning and 66.1% in the evening. The most fires (16.3%) took place on Monday, and the least (11.6%) on Wednesday.
 According to the 319 incident reports from years 2002 - 2018 most fires (14.1%) took place during March, and the least (3.8%) in October.
 Out of all 2,384 cases reported during the years 2002 - 2018, the most belonged to the categories: Rescue & EMS (62.5%), Fire (13.4%), and Good Intent Call (8.6%).
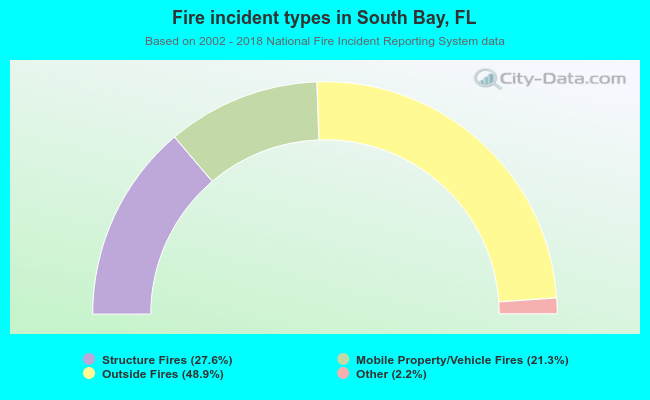 When looking into fire subcategories, the most incidents belonged to: Outside Fires (48.9%), and Structure Fires (27.6%).