South Barrington: Fire Incidents, Illinois (IL)
Where are fire incidents reported in South Barrington, IL
Something went wrong! Please refresh the page.
|
| |||||||||||||||||||||||||||||||||||||||||||||||||||||||||||||||||||||||||||||||||||||||||||||||||||||||||||||
2002 - 2018 National Fire Incident Reporting System (NFIRS) incidents
- Incident types reported to NFIRS in South Barrington, IL
- 1,66655.9%Rescue & EMS
- 61120.5%False Alarm
- 2267.6%Good Intent Call
- 1936.5%Fire
- 1575.3%Hazardous Condition
- 1163.9%Service Call
- 40.1%Severe Weather
- 30.1%Overpressure Rupture
- 30.1%Special Incident
- Fire incident types reported to NFIRS in South Barrington, IL
- 12665.3%Structure Fires
- 3618.7%Outside Fires
- 2613.5%Mobile Property/Vehicle Fires
- 52.6%Other
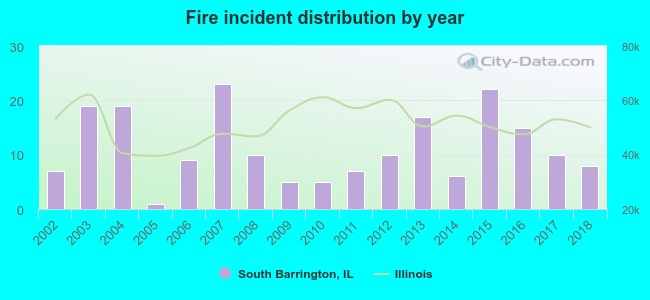 According to the data from the years 2002 - 2018 the average number of fires per year is 11. The highest number of fires - 23 took place in 2007, and the least - 1 in 2005. The data has a rising trend.
 30.1% incidents where reported in the morning and 69.9% in the evening. The most fires (27.5%) took place on Monday, and the least (4.7%) on Thursday.
 Based on the 193 reports from years 2002 - 2018 most fires (26.9%) took place during May, and the least (3.6%) in March.
 Out of all 2,979 cases reported during the years 2002 - 2018, the most belonged to the categories: Rescue & EMS (55.9%), False Alarm (20.5%), and Good Intent Call (7.6%).
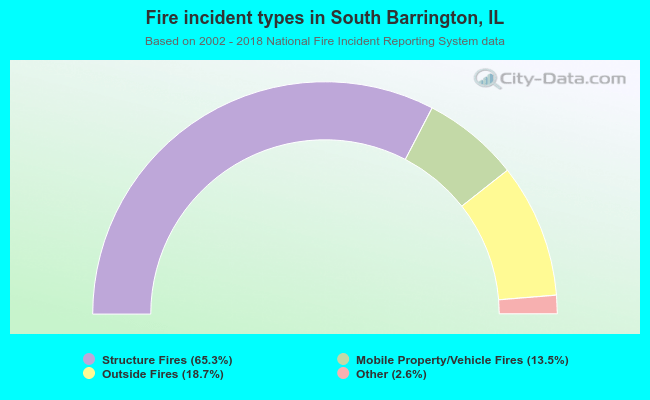 When looking into fire subcategories, the most incidents belonged to: Structure Fires (65.3%), and Outside Fires (18.7%).