Somerville: Fire Incidents, New Jersey (NJ)
Where are fire incidents reported in Somerville, NJ
Something went wrong! Please refresh the page.
| Fire incidents reported | |
|---|---|
| Sreet name | Count |
| MAIN ST | 214 |
| MOUNTAIN AVE | 150 |
| CLIFF ST | 80 |
| BRIDGE ST | 58 |
| SOMERSET ST | 56 |
| HIGH ST | 44 |
| VETERANS MEMORIAL DR | 42 |
| FAIRVIEW AVE | 38 |
| REHILL AVE | 34 |
| DAVENPORT ST | 32 |
| GASTON AVE | 26 |
| MERCER ST | 26 |
| DIVISION ST | 20 |
| DOUGHTY AVE | 20 |
| GROVE ST | 20 |
| UNION AVE | 18 |
| WEST END AVE | 16 |
| BROOKSIDE | 14 |
| DAVENPORT | 14 |
| NEW ST | 14 |
| OAK TERRACE | 14 |
| ORCHARD ST | 14 |
| SPRING ST | 14 |
| 3RD ST | 10 |
| ALTAMONT PL | 10 |
| BARTINE ST | 10 |
| BROOKSIDE AVE | 10 |
| BROWN ST | 10 |
| GRANT AVE | 10 |
| AUTEN AVE | 8 |
2003 - 2018 National Fire Incident Reporting System (NFIRS) incidents
- Incident types reported to NFIRS in Somerville, NJ
- 89034.1%False Alarm
- 65725.2%Fire
- 62323.9%Hazardous Condition
- 2338.9%Good Intent Call
- 1094.2%Rescue & EMS
- 913.5%Service Call
- 40.2%Overpressure Rupture
- Fire incident types reported to NFIRS in Somerville, NJ
- 42364.4%Structure Fires
- 18928.8%Outside Fires
- 365.5%Mobile Property/Vehicle Fires
- 91.4%Other
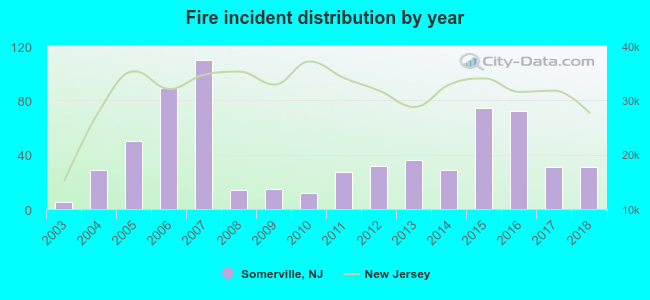 Based on the data from the years 2003 - 2018 the average number of fire incidents per year is 41. The highest number of reported fire incidents - 110 took place in 2007, and the least - 5 in 2003. The data has a rising trend.
The average number of yearly fire incidents per 10k residents in Somerville, NJ compared to nearest cities:
(Note: Based on data for the last 3 years, including only cities with population 5,000 and above)
| Somerville: | 36.8 |
| Finderne: | 1.8 |
| Raritan: | 23.5 |
| Manville: | 7.7 |
| Martinsville: | 19.5 |
| Bound Brook: | 2.4 |
| Middlesex: | 2.9 |
| Dunellen: | 9.0 |
| Somerset: | 43.2 |
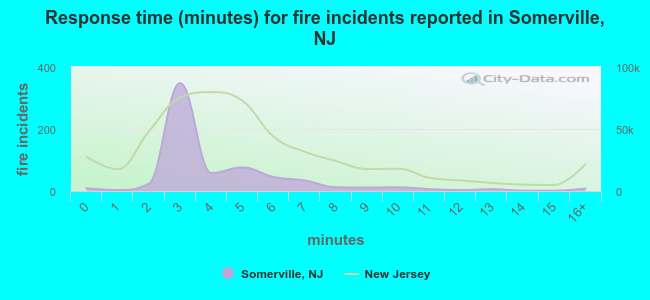 The median response time based on all reported fire incidents is 3 minutes. This is lower than the New Jersey median value.
The median response time in Somerville, NJ compared to nearest cities:
(Note: Based on data for all years, including only cities with at least 500 fire incidents)
| Somerville: | 3 minutes |
| Somerset: | 8 minutes |
| Voorhees: | 6 minutes |
| North Plainfield: | 5 minutes |
| New Brunswick: | 3 minutes |
| South Plainfield: | 4 minutes |
| Plainfield: | 5 minutes |
| Highland Park: | 2 minutes |
| Berkeley Heights: | 5 minutes |
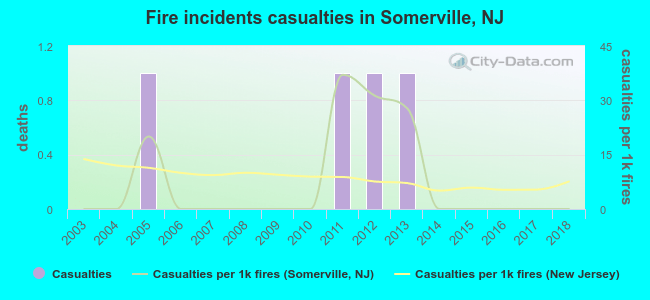 Based on the reports from the years 2003 - 2018 the average number of fire-related casualties per year is 0. The highest number of casualties - 1 took place in 2005, and the lowest - 0 in 2003. The data has a constant trend.
The average number of injuries per 1,000 fires is 7. This indicator was the highest - 37 in 2011, and the lowest 0 in 2003. The trend for casualties per 1,000 fire incidents is constant. Compared to the New Jersey value the number of casualties per 1,000 fires is lower.
Based on the reports from the years 2003 - 2018 the average number of fire-related casualties per year is 0. The highest number of casualties - 1 took place in 2005, and the lowest - 0 in 2003. The data has a constant trend.
The average number of injuries per 1,000 fires is 7. This indicator was the highest - 37 in 2011, and the lowest 0 in 2003. The trend for casualties per 1,000 fire incidents is constant. Compared to the New Jersey value the number of casualties per 1,000 fires is lower.Casualties per 1,000 incidents in Somerville, NJ compared to nearest cities:
(Note: Based on data for all years, including only cities with at least 500 fire incidents)
| Somerville: | 6.1 |
| Somerset: | 5.0 |
| Voorhees: | 2.7 |
| North Plainfield: | 31.9 |
| New Brunswick: | 11.6 |
| South Plainfield: | 21.8 |
| Plainfield: | 16.7 |
| Highland Park: | 7.3 |
| Berkeley Heights: | 19.2 |
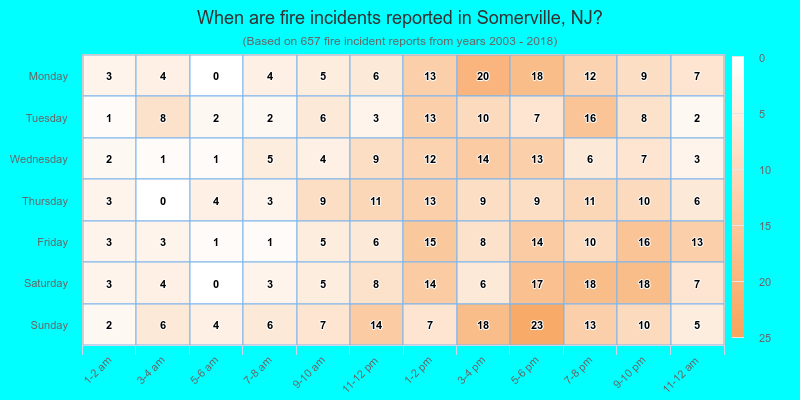
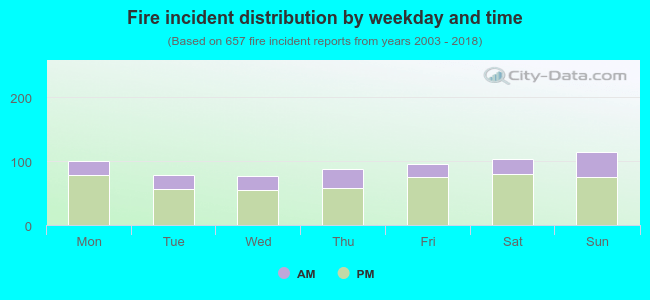 26.9% incidents where reported in the morning and 73.1% in the evening. The most fires (17.5%) took place on Sunday, and the least (11.7%) on Wednesday.
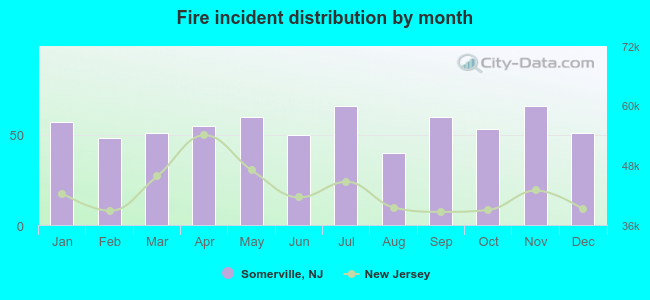 Based on the 657 fire incident reports from years 2003 - 2018 most fires (10.0%) took place during July, and the least (6.1%) in August.
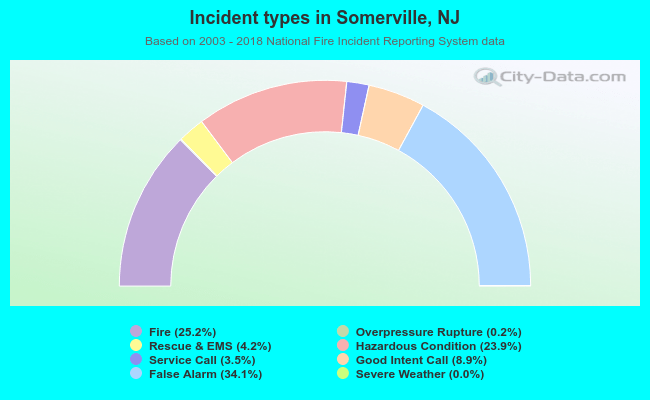 Out of all 2,608 cases reported during the years 2003 - 2018, the most belonged to the categories: False Alarm (34.1%), Fire (25.2%), and Hazardous Condition (23.9%).
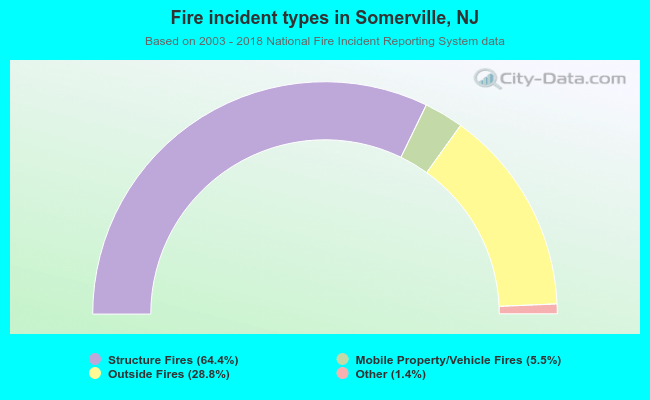 When looking into fire subcategories, the most incidents belonged to: Structure Fires (64.4%), and Outside Fires (28.8%).