Solvang: Fire Incidents, California (CA)
Where are fire incidents reported in Solvang, CA
Something went wrong! Please refresh the page.
|
| |||||||||||||||||||||||||||||||||||||||||||||||||||||||||||||||||||||||||||||||||||||||||||||||||||||||||||||
2005 - 2018 National Fire Incident Reporting System (NFIRS) incidents
- Incident types reported to NFIRS in Solvang, CA
- 1,48655.7%Rescue & EMS
- 44616.7%Good Intent Call
- 34713.0%Service Call
- 1385.2%False Alarm
- 1345.0%Fire
- 1124.2%Hazardous Condition
- 30.1%Special Incident
- Fire incident types reported to NFIRS in Solvang, CA
- 6246.3%Outside Fires
- 5440.3%Structure Fires
- 118.2%Mobile Property/Vehicle Fires
- 75.2%Other
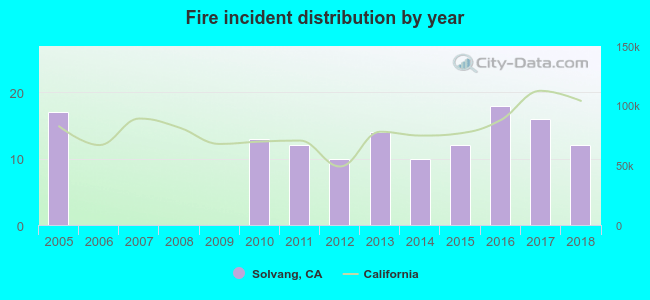 According to the data from the years 2005 - 2018 the average number of fires per year is 10. The highest number of reported fires - 18 took place in 2016, and the least - 0 in 2006. The data has a declining trend.
The average number of yearly fire incidents per 10k residents in Solvang, CA compared to nearest cities:
(Note: Based on data for the last 3 years, including only cities with population 5,000 and above)
| Solvang: | 27.8 |
| Buellton: | 52.2 |
| Lompoc: | 43.0 |
| Isla Vista: | 7.5 |
| Goleta: | 26.2 |
| Orcutt: | 2.1 |
| Santa Barbara: | 23.4 |
| Santa Maria: | 28.3 |
| Montecito: | 4.1 |
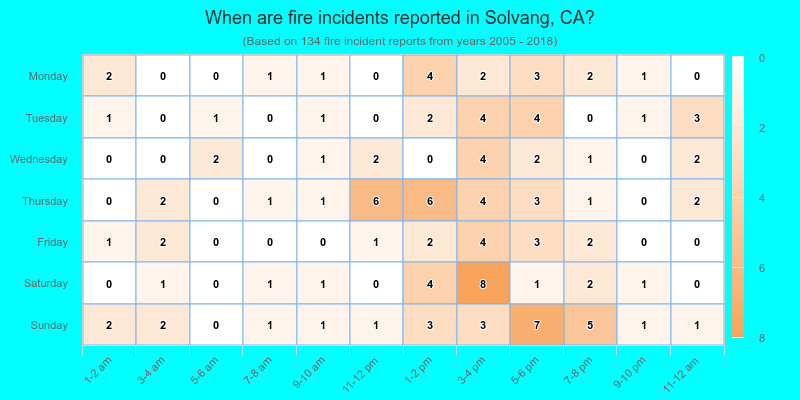
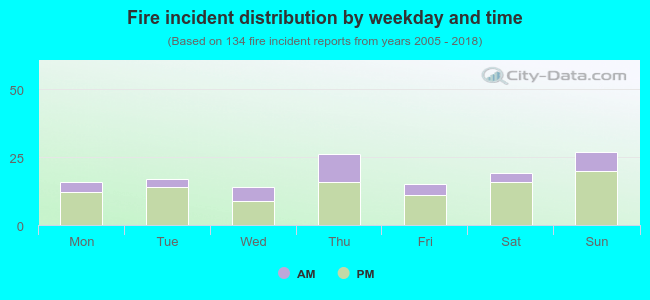 26.9% incidents where reported in the morning and 73.1% in the evening. The most fires (20.1%) took place on Sunday, and the least (10.4%) on Wednesday.
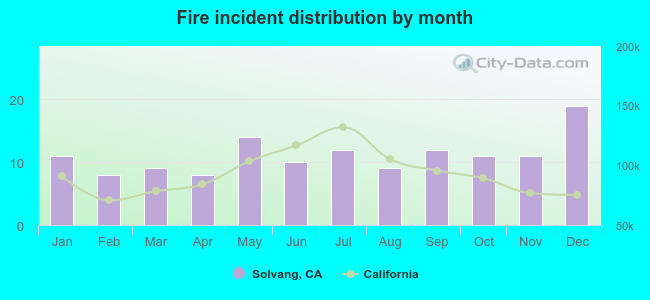 According to the 134 reports from years 2005 - 2018 most fires (14.2%) took place during December, and the least (6.0%) in February.
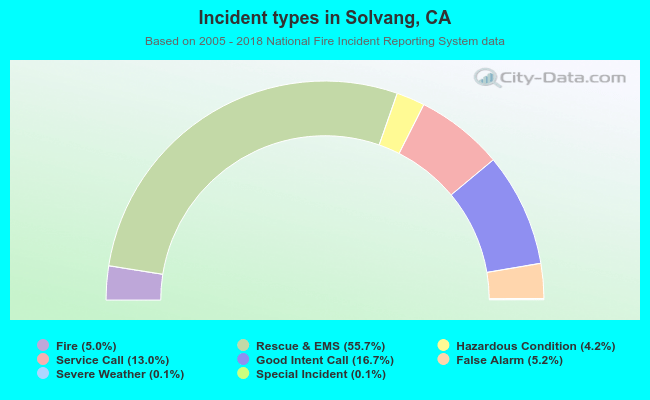 Out of all 2,668 cases reported during the years 2005 - 2018, the most belonged to the categories: Overpressure Rupture (55.7%), Service Call (16.7%), and Hazardous Condition (13.0%).
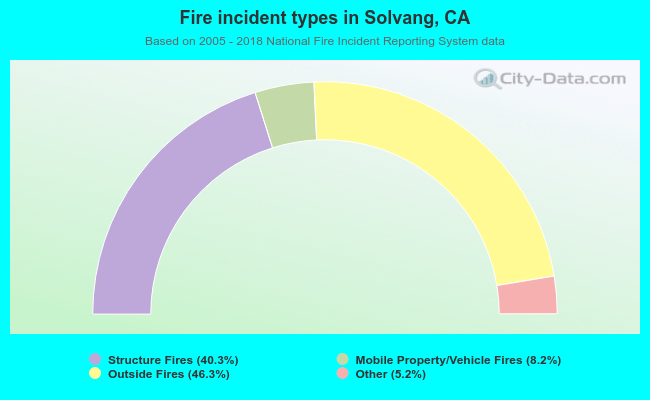 When looking into fire subcategories, the most incidents belonged to: Outside Fires (46.3%), and Structure Fires (40.3%).