| Fire incidents reported |
|---|
| Sreet name | Count |
|---|
| SOCIETY HILL RD | 20 | | BYRD RD | 14 | | HARTSVILLE HWY | 12 | | CAMP COKER RD | 10 | | SANDY FLATS RD | 10 | | 52 HWY | 8 | | BOGGY BRANCH RD | 6 | | JAMES BOONE LN | 6 | | MAIN ST | 6 | | MOREE RD | 6 | | OLD CAMDEN RD | 6 | | ATKINSON FARMS LN | 4 | | BUCKHOLTS CREEK RD | 4 | | HARRIS CREEK CHURCH RD | 4 | | HWY 52 | 4 | | JAMES RD | 4 | | LINCOLN RD | 4 | | LUMBER RD | 4 | | PATRICK/ SOCIETY HILL HWY | 4 | | ROSENWALD ST | 4 | | ALMA LN | 2 | | BELLE AIRE ST | 2 | | BELLE VUE DR | 2 | | BURLINGTON DR | 2 | | BURLINGTON DR. | 2 |
| | | Fire incidents reported |
|---|
| Sreet name | Count |
|---|
| CAMP COKER ROAD | 2 | | CHERAW HWY | 2 | | CROWLEY HILL RD | 2 | | DUKE RD | 2 | | FLOYDS RD | 2 | | FRANK KELLY RD | 2 | | GIBSON ST | 2 | | GOV WILLIAMS | 2 | | GRANT DR | 2 | | GUNN MILL ROAD | 2 | | HALLIE BRYANT RD | 2 | | HWY.52 | 2 | | KEITH DR | 2 | | KELLY RD | 2 | | LAKE DARPO RD52 | 2 | | MAIN STWILLIAMSON DR | 2 | | MCBRIDE DR | 2 | | MOREE ST | 2 | | PINEBARK LN | 2 | | PRESSLY AVE | 2 | | QUIET BROOK RD | 2 | | ROSENWALD | 2 | | ROSENWALD ST | 2 | | RUSSELL | 2 | | SECONDARY 20 | 2 |
|
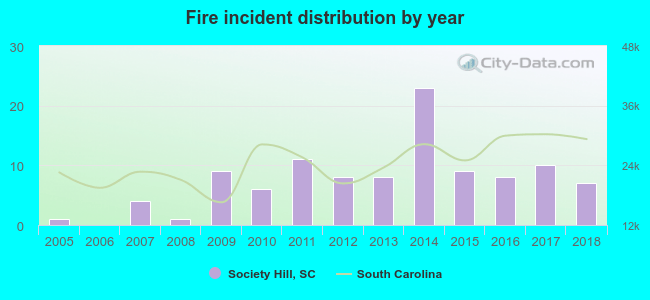 Based on the data from the years 2005 - 2018 the average number of fire incidents per year is 8. The highest number of fire incidents - 23 took place in 2014, and the least - 0 in 2006. The data has a growing trend.
 22.9% incidents where reported in the morning and 77.1% in the evening. The most fires (20.0%) took place on Sunday, and the least (8.6%) on Tuesday.
 According to the 105 fire incident reports from years 2005 - 2018 most fires (19.0%) took place during March, and the least (4.8%) in July.
 Out of all 261 cases reported during the years 2005 - 2018, the most belonged to the categories: Fire (40.2%), Overpressure Rupture (21.5%), and Rescue & EMS (14.9%).
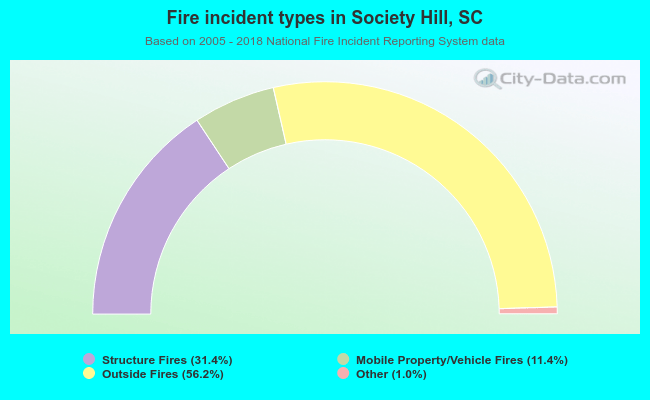 When looking into fire subcategories, the most reports belonged to: Outside Fires (56.2%), and Structure Fires (31.4%).