| Fire incidents reported |
|---|
| Sreet name | Count |
|---|
| HWY 90 | 40 | | RIVER RD | 14 | | 2045 3RD AVENUE | 12 | | INTERSTATE 10 | 12 | | OLD SPANISH | 10 | | OLD SPANISH TRAIL | 10 | | RIVER ROAD | 10 | | 3RD AVE | 8 | | HIGHWAY 90 | 8 | | MCKEOWN MILL | 8 | | RIVER | 8 | | 90 | 6 | | ACI DRIVE | 6 | | HOWELL RD | 6 | | I10 | 6 | | LAKE SEMINOLE ROAD | 6 | | MCKEOWN MILL RD | 6 | | MESSER | 6 | | OLD SPANISH TRAIL RD | 6 | | SANDRIDGE CH | 6 | | VICTORIA LANE | 6 | | 2045 3RD AVE | 4 | | 2591 SANDRIDGE ROAD | 4 | | 7753 HOWELL ROAD | 4 | | BLUEBERRY DR | 4 |
| | | Fire incidents reported |
|---|
| Sreet name | Count |
|---|
| DALEMBERTE | 4 | | DESOTO AVE | 4 | | GILLEY RD | 4 | | GULF POWER RD | 4 | | HOME FRONT RD | 4 | | HOMEFRONT RD | 4 | | HOWELL | 4 | | I-10 | 4 | | KEEVERS ROAD | 4 | | LITTLE ZION | 4 | | MCKEOWN MILL RD RD | 4 | | MCKEOWN MILL ROAD | 4 | | OHARA AV | 4 | | RAILROAD LN | 4 | | SALEM CHURCH RD | 4 | | SALEM CHURCH ROAD | 4 | | SHADY GROVE | 4 | | SNEADS LANDING ROAD | 4 | | TANGLEWOOD RD | 4 | | THIRD AVE | 4 | | 1153 LANDING ROAD | 2 | | 1205 TANGLEWOOD RD | 2 | | 1208 TANGLEWOOD | 2 | | 122 PEACH ORCHARD DRIVE ACI | 2 | | |
|
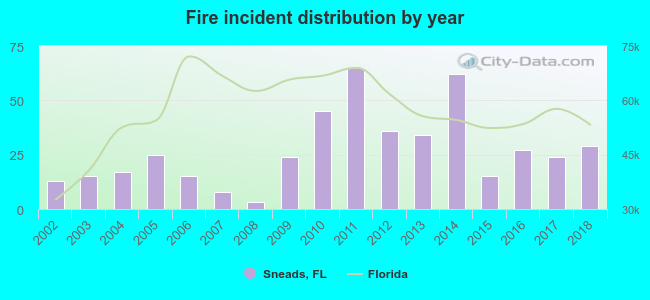 According to the data from the years 2002 - 2018 the average number of fires per year is 27. The highest number of reported fire incidents - 65 took place in 2011, and the least - 3 in 2008. The data has an increasing trend.
 36.8% incidents where reported in the morning and 63.2% in the evening. The most fires (21.2%) took place on Saturday, and the least (11.2%) on Thursday.
 Based on the 457 fires from years 2002 - 2018 most fires (12.7%) took place during March, and the least (4.2%) in September.
 Out of all 2,681 cases reported during the years 2002 - 2018, the most belonged to the categories: Rescue & EMS (78.7%), Fire (17.0%), and Good Intent Call (2.3%).
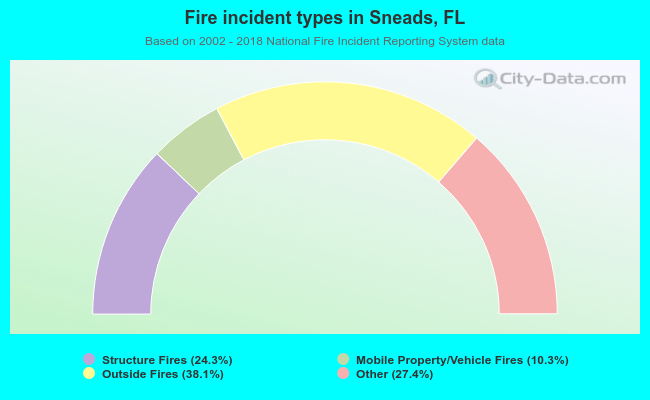 When looking into fire subcategories, the most incidents belonged to: Outside Fires (38.1%), and Other (27.4%).