Smyrna: Fire Incidents, Tennessee (TN)
Where are fire incidents reported in Smyrna, TN
Something went wrong! Please refresh the page.
| Fire incidents reported | |
|---|---|
| Sreet name | Count |
| LOWRY ST | 242 |
| ENON SPRINGS RD | 164 |
| NISSAN DR | 152 |
| OLD NASHVILLE HWY | 118 |
| ALMAVILLE RD | 114 |
| SAM RIDLEY PKW | 112 |
| ROCK SPRINGS RD | 106 |
| JOYNER DR | 84 |
| ROCKY FORK RD | 74 |
| IMPERIAL BLVD | 70 |
| SAM RIDLEY PKWY | 64 |
| WEAKLEY LN | 64 |
| MASON TUCKER DR | 62 |
| SAM RIDLEY PKY | 62 |
| I24 | 50 |
| I24 HWY | 50 |
| HAZELWOOD DR | 44 |
| INDUSTRIAL BLVD | 40 |
| COUNTRY VILLAGE DR | 36 |
| SAM RIDLEY | 36 |
| WINDELLWOOD CIR | 34 |
| CHANEY RD | 32 |
| JEFFERSON PKE | 32 |
| FLORENCE RD | 28 |
| G ST | 28 |
| SWAN DR | 28 |
| I-24 | 26 |
| NEEDHAM DR | 24 |
| SAM DAVIS RD | 24 |
| ENON SPRINGS R | 22 |
| Other | 474 |
2002 - 2018 National Fire Incident Reporting System (NFIRS) incidents
- Incident types reported to NFIRS in Smyrna, TN
- 3,19121.5%Rescue & EMS
- 3,06520.7%Good Intent Call
- 2,49616.8%Fire
- 2,42816.4%False Alarm
- 1,96013.2%Service Call
- 1,65111.1%Hazardous Condition
- Fire incident types reported to NFIRS in Smyrna, TN
- 91936.8%Structure Fires
- 89735.9%Outside Fires
- 63625.5%Mobile Property/Vehicle Fires
- 441.8%Other
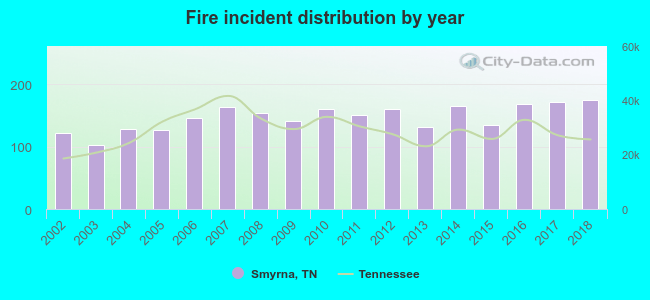 According to the data from the years 2002 - 2018 the average number of fire incidents per year is 147. The highest number of reported fire incidents - 174 took place in 2018, and the least - 102 in 2003. The data has a rising trend.
The average number of yearly fire incidents per 10k residents in Smyrna, TN compared to nearest cities:
(Note: Based on data for the last 3 years, including only cities with population 5,000 and above)
| Smyrna: | 37.8 |
| La Vergne: | 1.8 |
| Nolensville: | 35.8 |
| Lascassas: | 23.1 |
| Murfreesboro: | 42.6 |
| Brentwood: | 22.5 |
| Mount Juliet: | 23.0 |
| Franklin: | 30.3 |
| Lebanon: | 91.1 |
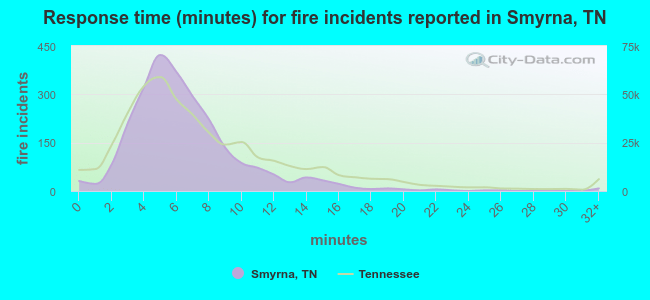 The median response time based on all reported fire incidents is 6 minutes. This is comparable to the Tennessee median value.
The median response time in Smyrna, TN compared to nearest cities:
(Note: Based on data for all years, including only cities with at least 500 fire incidents)
| Smyrna: | 6 minutes |
| La Vergne: | 3 minutes |
| Murfreesboro: | 6 minutes |
| Brentwood: | 6 minutes |
| Mount Juliet: | 9 minutes |
| Franklin: | 6 minutes |
| Lebanon: | 7 minutes |
| Christiana: | 11 minutes |
| Hendersonville: | 5 minutes |
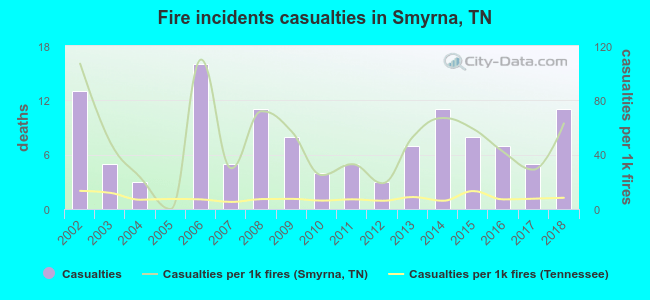 According to the reports from the years 2002 - 2018 the average number of fire-related casualties per year is 7. The highest number of casualties - 16 took place in 2006, and the lowest - 0 in 2005. The data has a dropping trend.
The average number of casualties per 1,000 fire incidents is 49. This indicator was the highest - 110 in 2006, and the lowest 0 in 2005. The trend for injuries per 1,000 incidents is declining. Compared to the Tennessee value the number of injuries per 1,000 fire incidents is much higher.
According to the reports from the years 2002 - 2018 the average number of fire-related casualties per year is 7. The highest number of casualties - 16 took place in 2006, and the lowest - 0 in 2005. The data has a dropping trend.
The average number of casualties per 1,000 fire incidents is 49. This indicator was the highest - 110 in 2006, and the lowest 0 in 2005. The trend for injuries per 1,000 incidents is declining. Compared to the Tennessee value the number of injuries per 1,000 fire incidents is much higher.Casualties per 1,000 incidents in Smyrna, TN compared to nearest cities:
(Note: Based on data for all years, including only cities with at least 500 fire incidents)
| Smyrna: | 48.9 |
| La Vergne: | 3.2 |
| Murfreesboro: | 12.2 |
| Brentwood: | 8.9 |
| Mount Juliet: | 12.6 |
| Franklin: | 12.8 |
| Lebanon: | 4.6 |
| Christiana: | 0.0 |
| Hendersonville: | 30.0 |
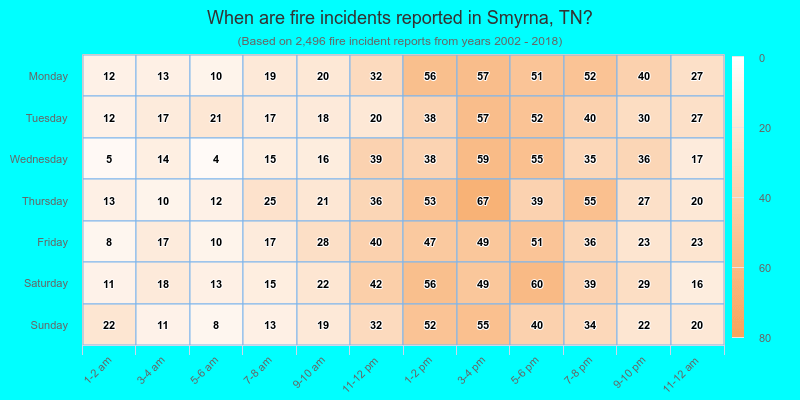
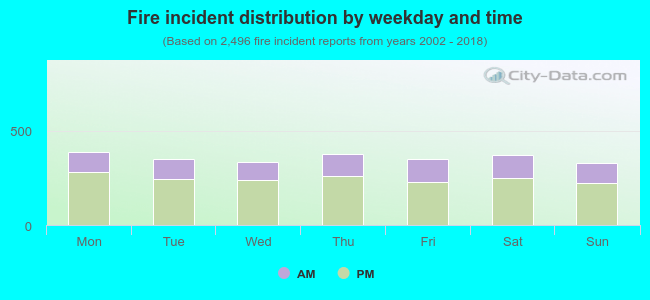 30.7% incidents where reported in the morning and 69.3% in the evening. The most fires (15.6%) took place on Monday, and the least (13.1%) on Sunday.
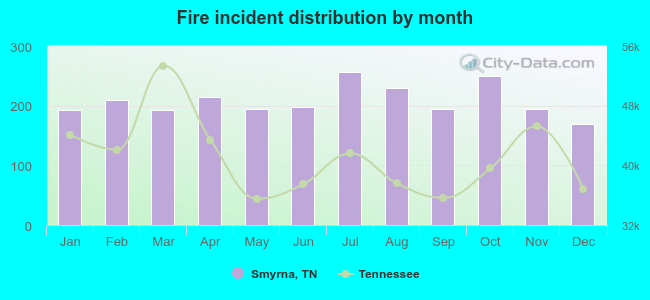 Based on the 2,496 fires from years 2002 - 2018 most fires (10.3%) took place during July, and the least (6.8%) in December.
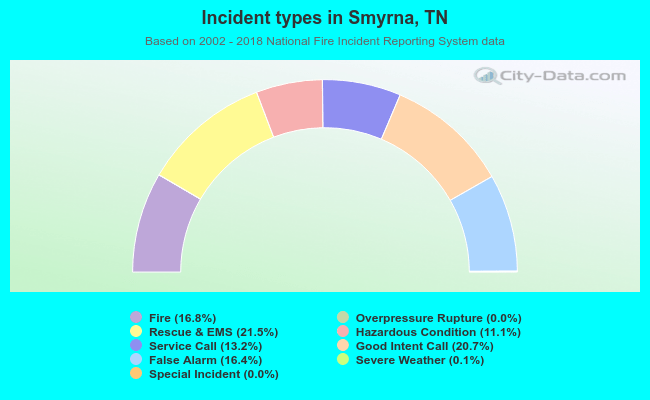 Out of all 14,814 cases reported during the years 2002 - 2018, the most belonged to the categories: Rescue & EMS (21.5%), Good Intent Call (20.7%), and Fire (16.8%).
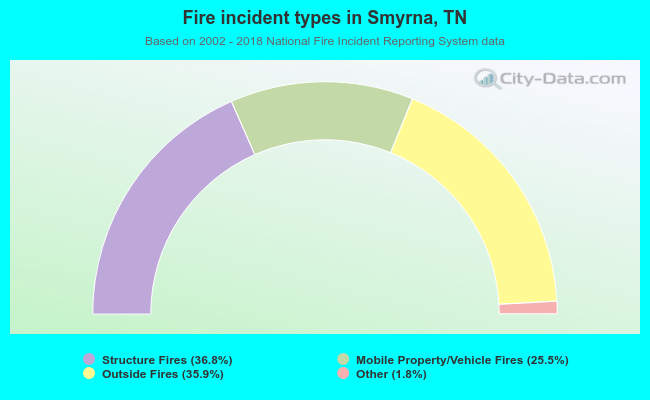 When looking into fire subcategories, the most incidents belonged to: Structure Fires (36.8%), and Outside Fires (35.9%).