| Fire incidents reported |
|---|
| Sreet name | Count |
|---|
| HWY 101 | 18 | | INDIAN RD | 18 | | HWY 197 | 6 | | LOW DIVIDE RD | 6 | | OCEANVIEW DR | 6 | | 101 HWY | 4 | | 130 WILSON LANE | 4 | | 14311 HWY 101 | 4 | | BROOKINGS ST | 4 | | FIRST ST | 4 | | FRED HAIGHT DR | 4 | | HIGHWAY 101 | 4 | | HWY 101 N. | 4 | | OCEAN VIEW DR | 4 | | SALMON HARBOR RD | 4 | | SARINA RD | 4 | | 111 DEAN LANE | 2 | | 12000 HWY 101 N. | 2 | | 12370 SHIP ASHORE MOTEL | 2 | | 12380 OCEANVIEW DR | 2 | | 12400 SOUTH INDIAN ROAD | 2 | | 12840 MOUTH OF SMITH RIVER RD | 2 | | 130 CLUB DRIVE | 2 | | 133 CLUB DRIVE | 2 | | 13451 OCEAN VIEW DR | 2 |
| | | Fire incidents reported |
|---|
| Sreet name | Count |
|---|
| 13733 OCEAN VIEW DR | 2 | | 140 BROOKINGS STREET | 2 | | 14311 MIRANDA LANE | 2 | | 144 WALLACE | 2 | | 161 WILSON LN | 2 | | 162 HIGH MEADOWS | 2 | | 16840 HWY 101 | 2 | | 190 WILSON LANE | 2 | | 2000 LOW DIVIDE ROAD | 2 | | 320 ASHFORD ROAD | 2 | | 449 FIRST STREET | 2 | | 449 FRIST STREET | 2 | | 4915 BIG FLAT RD | 2 | | 55 ROSE LANE | 2 | | 569 FRED HAIGHT DRIVE | 2 | | 6351 KINGS VALLEY RD | 2 | | 6590 SOUTH BANK RD | 2 | | 734 W. FIRST STREET | 2 | | 765 MOUTH SMITH RIVER ROAD | 2 | | BELL HOLE LOOP | 2 | | BIG FLAT RD | 2 | | BOLEN LN | 2 | | BROOKINGS | 2 | | BROOKINGS AVE | 2 | | CHARLIE DR | 2 |
|
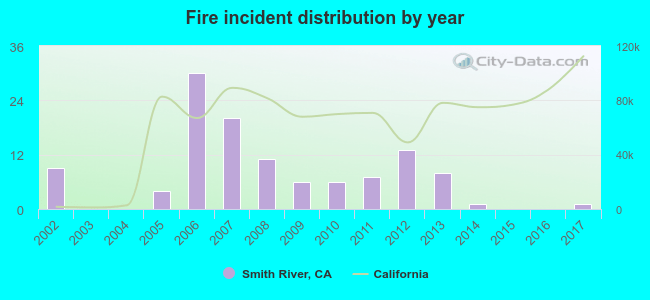 According to the data from the years 2002 - 2017 the average number of fire incidents per year is 7. The highest number of reported fire incidents - 30 took place in 2006, and the least - 0 in 2003. The data has a dropping trend.
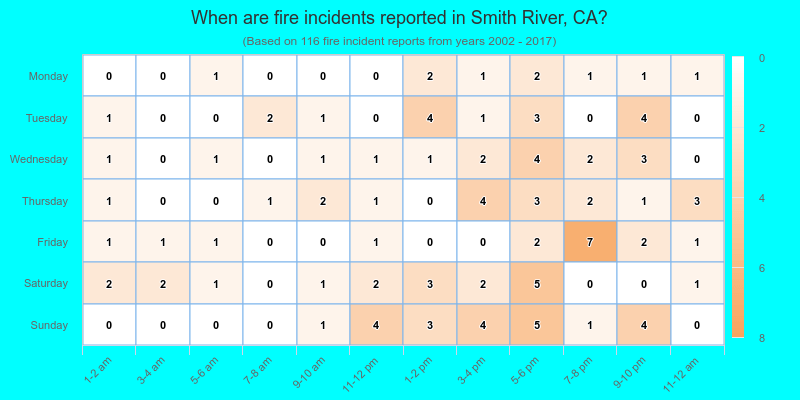
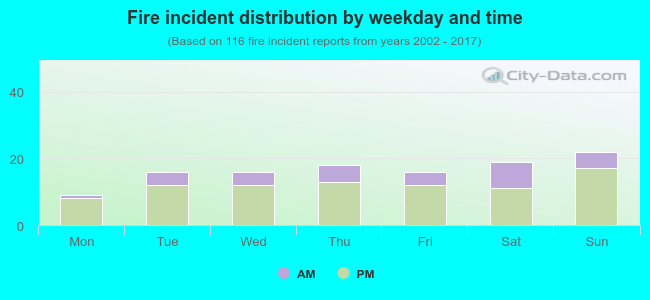 26.7% incidents where reported in the morning and 73.3% in the evening. The most fires (19.0%) took place on Sunday, and the least (7.8%) on Monday.
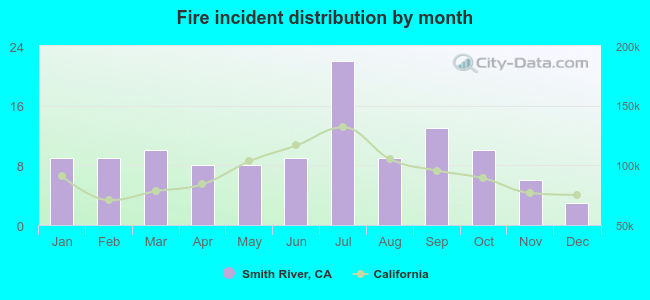 According to the 116 reports from years 2002 - 2017 most fires (19.0%) took place during July, and the least (2.6%) in December.
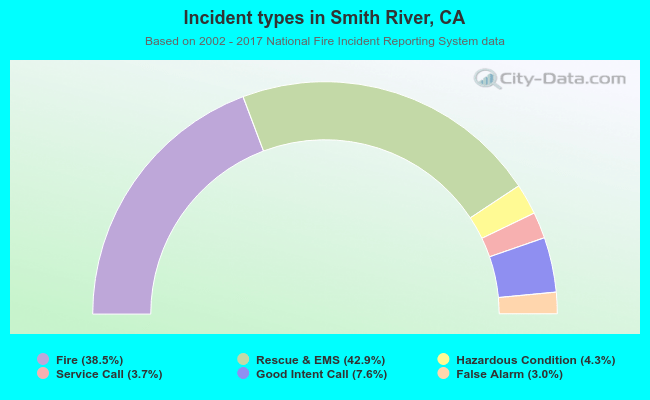 Out of all 301 cases reported during the years 2002 - 2017, the most belonged to the categories: Overpressure Rupture (42.9%), Fire (38.5%), and Service Call (7.6%).
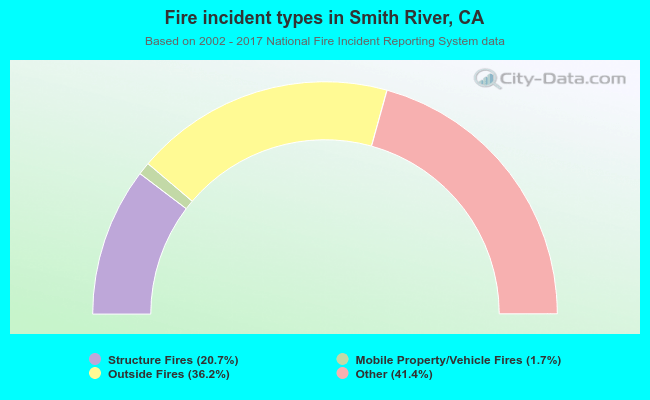 When looking into fire subcategories, the most reports belonged to: Other (41.4%), and Outside Fires (36.2%).