Slippery Rock: Fire Incidents, Pennsylvania (PA)
Where are fire incidents reported in Slippery Rock, PA
Something went wrong! Please refresh the page.
|
| |||||||||||||||||||||||||||||||||||||||||||||||||||||||||||||||||||||||||||||||||||||||||||||||||||||||||||||
2002 - 2018 National Fire Incident Reporting System (NFIRS) incidents
- Incident types reported to NFIRS in Slippery Rock, PA
- 26727.7%Rescue & EMS
- 21121.9%False Alarm
- 16617.2%Fire
- 15115.6%Good Intent Call
- 10310.7%Service Call
- 666.8%Hazardous Condition
- 10.1%Special Incident
- Fire incident types reported to NFIRS in Slippery Rock, PA
- 7847.0%Structure Fires
- 4728.3%Outside Fires
- 2112.7%Mobile Property/Vehicle Fires
- 2012.0%Other
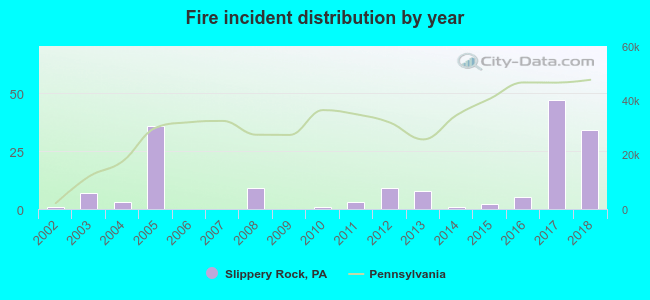 According to the data from the years 2002 - 2018 the average number of fires per year is 10. The highest number of fire incidents - 47 took place in 2017, and the least - 0 in 2006. The data has a rising trend.
 31.3% incidents where reported in the morning and 68.7% in the evening. The most fires (16.3%) took place on Tuesday, and the least (12.0%) on Wednesday.
 According to the 166 reports from years 2002 - 2018 most fires (18.7%) took place during April, and the least (3.0%) in September.
 Out of all 965 cases reported during the years 2002 - 2018, the most belonged to the categories: Overpressure Rupture (27.7%), Good Intent Call (21.9%), and Fire (17.2%).
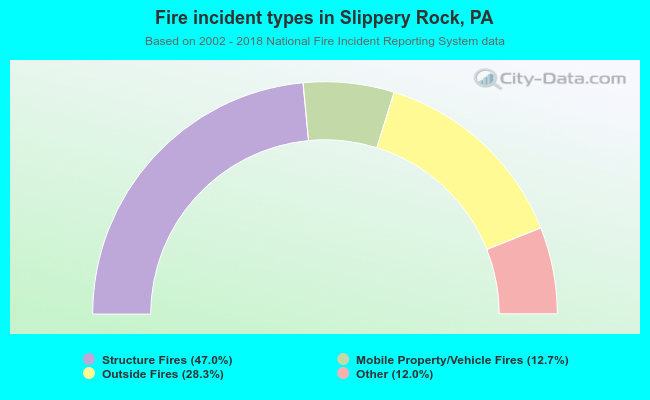 When looking into fire subcategories, the most incidents belonged to: Structure Fires (47.0%), and Outside Fires (28.3%).