| Fire incidents reported |
|---|
| Sreet name | Count |
|---|
| 819 RT | 22 | | STORY RD | 16 | | MAIN ST | 12 | | JAMISON ST | 10 | | RT 819 | 8 | | WINETOWN RD | 8 | | FENNELTOWN RD | 6 | | ROUTE 819 | 6 | | 2ND ST | 4 | | FROG LN | 4 | | HOFFMAN HEIGHTS RD | 4 | | KAUFMAN RD | 4 | | LITTLE ACRES LN | 4 | | PLANT RD | 4 | | ROUTE 22 | 4 | | 102 ROSEWOOD DR. | 2 | | 140 JAMISON STREET | 2 | | 142 EIDAMILLER RD. | 2 | | 240 GENERAL ST. LOMISON | 2 | | 288 NELSON | 2 | | 320 INDIANA AVE. | 2 | | 506 HEMLOCK WAY | 2 | | 518 LITTLE ACRES LANE | 2 | | 523 INDIANA AVE | 2 | | 524 CHESTNUT STEET | 2 |
| | | Fire incidents reported |
|---|
| Sreet name | Count |
|---|
| 819 N | 2 | | ASPEN DR | 2 | | ATHENA DR | 2 | | ATHENA RD | 2 | | BAILEY RD | 2 | | BLOCK BUSTER | 2 | | BRETT LANE | 2 | | CAROLINE ST | 2 | | CHURCH ST | 2 | | CONGRUITY RD | 2 | | CONGRUITY ROAD | 2 | | COTTAGE AVE | 2 | | COTTAGE LANE | 2 | | DAK VIEW | 2 | | DEPOT ST | 2 | | EAST PITTSBURGH STREET | 2 | | HANNAHSTOWN ROAD | 2 | | HANNASTOWN ROAD | 2 | | HART ST | 2 | | HOFFMAN HEIGTHS RD | 2 | | INDIANA AVE | 2 | | INDUSTRIAL DR | 2 | | KAPUSTA DRIVE | 2 | | KING RESTURANT | 2 | | |
|
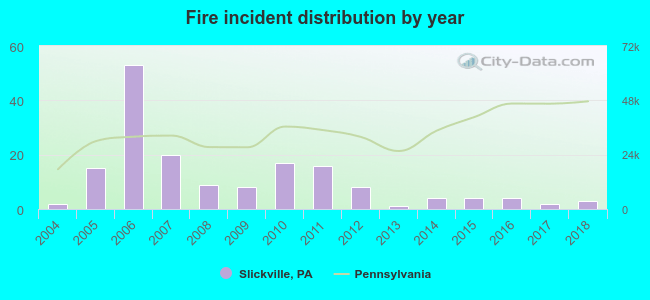 According to the data from the years 2004 - 2018 the average number of fires per year is 11. The highest number of fire incidents - 53 took place in 2006, and the least - 1 in 2013. The data has a rising trend.
 28.9% incidents where reported in the morning and 71.1% in the evening. The most fires (18.7%) took place on Tuesday, and the least (7.2%) on Thursday.
 According to the 166 reports from years 2004 - 2018 most fires (14.5%) took place during November, and the least (4.2%) in March.
 Out of all 292 cases reported during the years 2004 - 2018, the most belonged to the categories: Fire (56.8%), Rescue & EMS (26.4%), and Overpressure Rupture (8.2%).
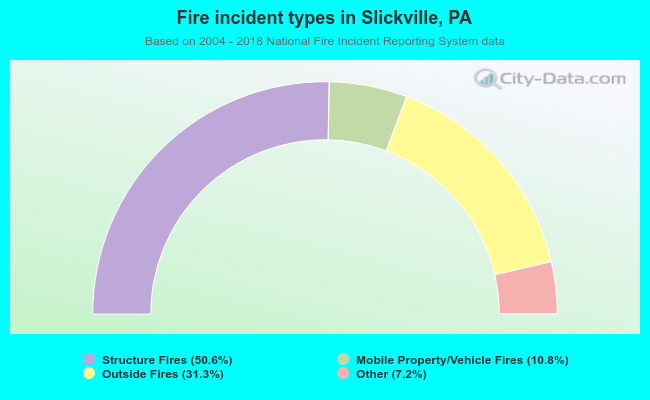 When looking into fire subcategories, the most incidents belonged to: Structure Fires (50.6%), and Outside Fires (31.3%).