Simla: Fire Incidents, Colorado (CO)
Where are fire incidents reported in Simla, CO
Something went wrong! Please refresh the page.
|
| |||||||||||||||||||||||||||||||||||||||||||||||||||||||||||||||||||||||||||||||||||||||||||||||||||||||||||||
2005 - 2018 National Fire Incident Reporting System (NFIRS) incidents
- Incident types reported to NFIRS in Simla, CO
- 16652.5%Fire
- 5015.8%Good Intent Call
- 3611.4%Rescue & EMS
- 247.6%False Alarm
- 227.0%Hazardous Condition
- 185.7%Service Call
- Fire incident types reported to NFIRS in Simla, CO
- 11468.7%Outside Fires
- 3219.3%Structure Fires
- 127.2%Other
- 84.8%Mobile Property/Vehicle Fires
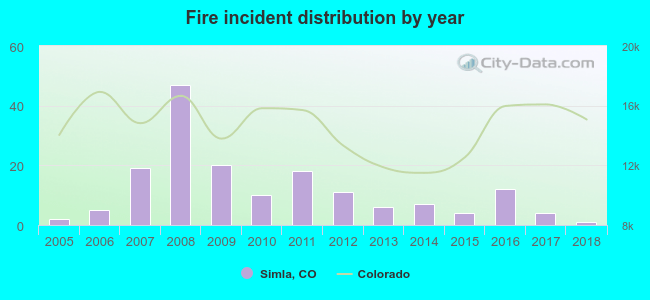 Based on the data from the years 2005 - 2018 the average number of fires per year is 12. The highest number of reported fires - 47 took place in 2008, and the least - 1 in 2018. The data has a declining trend.
 28.3% incidents where reported in the morning and 71.7% in the evening. The most fires (19.3%) took place on Saturday, and the least (10.2%) on Sunday.
 According to the 166 fire incident reports from years 2005 - 2018 most fires (18.1%) took place during June, and the least (2.4%) in February.
 Out of all 316 cases reported during the years 2005 - 2018, the most belonged to the categories: Fire (52.5%), Service Call (15.8%), and Overpressure Rupture (11.4%).
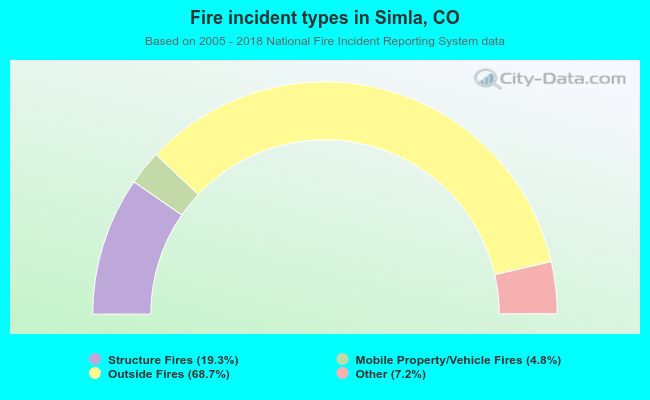 When looking into fire subcategories, the most incidents belonged to: Outside Fires (68.7%), and Structure Fires (19.3%).