Sierra Vista: Fire Incidents, Arizona (AZ)
Where are fire incidents reported in Sierra Vista, AZ
Something went wrong! Please refresh the page.
| Fire incidents reported | |
|---|---|
| Sreet name | Count |
| FRY BLVD | 104 |
| BUSBY DR | 56 |
| GARDEN AVE | 56 |
| HWY 92 | 54 |
| 7TH ST | 36 |
| HWY 90 | 34 |
| WILCOX DR | 34 |
| CARMICHAEL AVE | 32 |
| CORONADO DR | 30 |
| HIGHWAY 90 | 22 |
| LENZNER AVE | 22 |
| HIGHWAY 90 BYP | 20 |
| SAN PEDRO | 18 |
| HIGHWAY 92 | 16 |
| TACOMA ST | 16 |
| CANYON DR | 14 |
| EL CAMINO REAL | 14 |
| FRY BOULEVARD | 14 |
| HIGHWAY 92 HWY | 14 |
| MEDITERRANEAN DR | 14 |
| RAILROAD AVE | 14 |
| BST | 12 |
| CARMICHAEL | 12 |
| CHARLES DR | 12 |
| OAKMONT DR | 12 |
| PETERSON ST | 12 |
| AVENIDA COCHISE | 10 |
| BEL AIRE PL | 10 |
| BUFFALO SOLDIER TRL | 10 |
| CANYON | 10 |
| Other | 589 |
2002 - 2018 National Fire Incident Reporting System (NFIRS) incidents
- Incident types reported to NFIRS in Sierra Vista, AZ
- 11,81768.7%Rescue & EMS
- 2,04111.9%Service Call
- 1,3237.7%Fire
- 9305.4%Good Intent Call
- 6463.8%False Alarm
- 4262.5%Hazardous Condition
- Fire incident types reported to NFIRS in Sierra Vista, AZ
- 60545.7%Outside Fires
- 32224.3%Structure Fires
- 24618.6%Other
- 15011.3%Mobile Property/Vehicle Fires
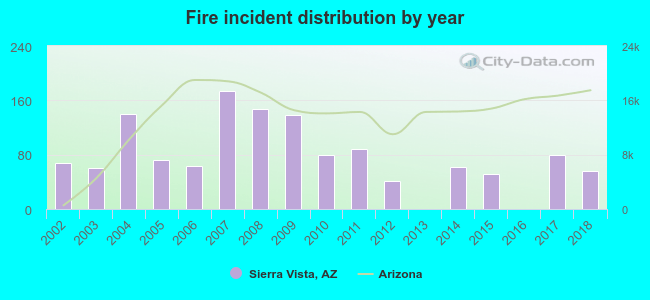 Based on the data from the years 2002 - 2018 the average number of fire incidents per year is 78. The highest number of fire incidents - 174 took place in 2007, and the least - 0 in 2013. The data has a dropping trend.
The average number of yearly fire incidents per 10k residents in Sierra Vista, AZ compared to nearest cities:
(Note: Based on data for the last 3 years, including only cities with population 5,000 and above)
| Sierra Vista: | 15.5 |
| Bisbee: | 25.4 |
| Vail: | 70.2 |
| Corona de Tucson: | 2.6 |
| Nogales: | 16.0 |
| Rio Rico: | 6.9 |
| Douglas: | 11.3 |
| Elfrida: | 14.1 |
| Green Valley: | 23.5 |
 The median response time based on all reported fire incidents is 6 minutes. This is about the same as the state median value.
 According to the reports from the years 2002 - 2018 the average number of fire-related casualties per year is 1. The highest number of reported casualties - 3 took place in 2015, and the lowest - 0 in 2002. The data has an increasing trend.
The average number of injuries per 1,000 fire incidents is 7. This indicator was the highest - 58 in 2015, and the lowest 0 in 2002. The trend for casualties per 1,000 fires is rising. Compared to the Arizona value the number of casualties per 1,000 incidents is higher.
According to the reports from the years 2002 - 2018 the average number of fire-related casualties per year is 1. The highest number of reported casualties - 3 took place in 2015, and the lowest - 0 in 2002. The data has an increasing trend.
The average number of injuries per 1,000 fire incidents is 7. This indicator was the highest - 58 in 2015, and the lowest 0 in 2002. The trend for casualties per 1,000 fires is rising. Compared to the Arizona value the number of casualties per 1,000 incidents is higher.
 33.2% incidents where reported in the morning and 66.8% in the evening. The most fires (17.2%) took place on Saturday, and the least (12.5%) on Wednesday.
 Based on the 1,323 incident reports from years 2002 - 2018 most fires (13.5%) took place during May, and the least (4.1%) in September.
 Out of all 17,209 cases reported during the years 2002 - 2018, the most belonged to the categories: Rescue & EMS (68.7%), Service Call (11.9%), and Fire (7.7%).
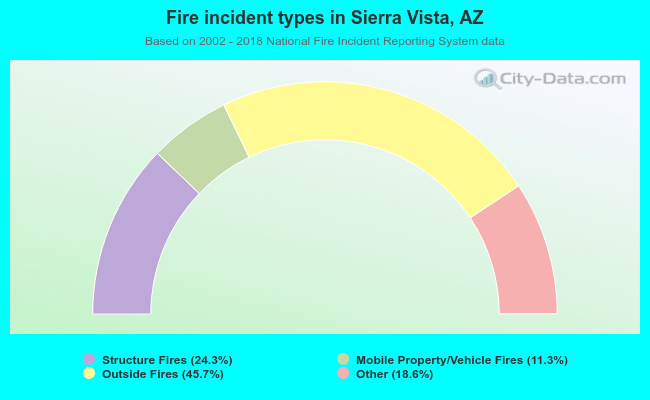 When looking into fire subcategories, the most reports belonged to: Outside Fires (45.7%), and Structure Fires (24.3%).