Sibley: Fire Incidents, Illinois (IL)
Where are fire incidents reported in Sibley, IL
Something went wrong! Please refresh the page.
|
| |||||||||||||||||||||||||||||||||||||||||||||||||||||||||||||||||||||||||||||||||||||||||||||||||||||||||||||
2003 - 2018 National Fire Incident Reporting System (NFIRS) incidents
- Incident types reported to NFIRS in Sibley, IL
- 10649.5%Fire
- 8338.8%Rescue & EMS
- 94.2%Service Call
- 52.3%Hazardous Condition
- 52.3%Severe Weather
- 31.4%Good Intent Call
- 10.5%Overpressure Rupture
- 10.5%False Alarm
- 10.5%Special Incident
- Fire incident types reported to NFIRS in Sibley, IL
- 5350.0%Outside Fires
- 2927.4%Structure Fires
- 1312.3%Other
- 1110.4%Mobile Property/Vehicle Fires
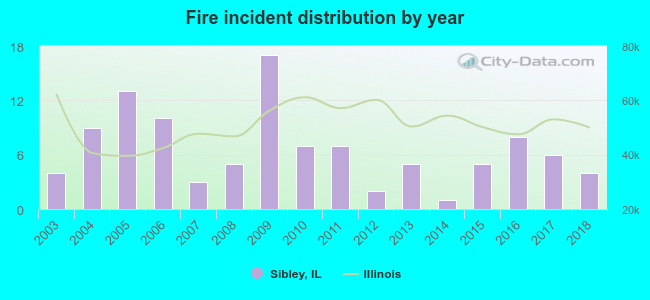 Based on the data from the years 2003 - 2018 the average number of fire incidents per year is 7. The highest number of fires - 17 took place in 2009, and the least - 1 in 2014. The data has a constant trend.
 25.5% incidents where reported in the morning and 74.5% in the evening. The most fires (17.9%) took place on Thursday, and the least (9.4%) on Sunday.
 Based on the 106 incident reports from years 2003 - 2018 most fires (18.9%) took place during April, and the least (2.8%) in January.
 Out of all 214 cases reported during the years 2003 - 2018, the most belonged to the categories: Fire (49.5%), Rescue & EMS (38.8%), and Service Call (4.2%).
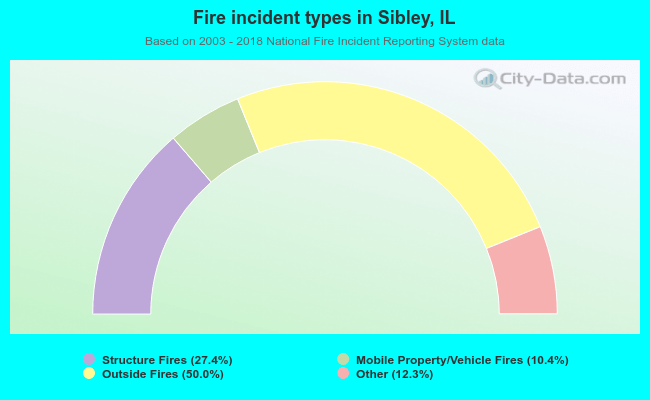 When looking into fire subcategories, the most reports belonged to: Outside Fires (50.0%), and Structure Fires (27.4%).