| Fire incidents reported |
|---|
| Sreet name | Count |
|---|
| MAIN ST | 30 | | MAIN ST | 24 | | MOHRSVILLE RD | 24 | | RIDGE RD | 24 | | RIDGE RD | 18 | | MOSELEM SPRINGS RD | 14 | | MOHRSVILLE RD | 12 | | WATER ST | 10 | | HALL RD | 8 | | PERRY RD | 8 | | POTTSVILLE PIKE | 8 | | POTTSVILLE PIKE ( RT. 61) PIKE | 8 | | POTTSVILLE PKE | 8 | | REBER ST | 8 | | RIDGE (73) RD | 8 | | ROUTE 61 | 8 | | STATE ST | 8 | | 3 RD ST | 6 | | ADAMS HOTEL RD | 6 | | BIRCH HILL RD | 6 | | CHURCH AV | 6 | | DREIBELBIS MILL RD | 6 | | NOBLE AV | 6 | | NORTH VIEW RD | 6 | | SCHAPPELL RD | 6 |
| | | Fire incidents reported |
|---|
| Sreet name | Count |
|---|
| SHOEMAKER AVE | 6 | | SHOEMAKERSVILLE RD | 6 | | VIRGINVILLE RD | 6 | | WINDSOR CASTLE RD | 6 | | WINDSOR CASTLE RD (73) | 6 | | 8 ST | 4 | | FRANKLIN ST | 4 | | GRANDVIEW RD | 4 | | INDUSTRIAL DR | 4 | | KINDTS CORNER RD | 4 | | LOWLAND RD | 4 | | MOSELEM SPRINGS RD | 4 | | MOSELEM SPRINGS RD (73) | 4 | | MOSELM SPRINGS RD | 4 | | NORTHVIEW AV | 4 | | OHLINGER RD | 4 | | ONYX CAVE RD | 4 | | PERRY RD | 4 | | POTTSVILLE PK | 4 | | RAILROAD RD | 4 | | RIDGE RD (73) | 4 | | ROUTE 662 (73) | 4 | | RT.61 | 4 | | SHOEMAKERSVILLE RD | 4 | | |
|
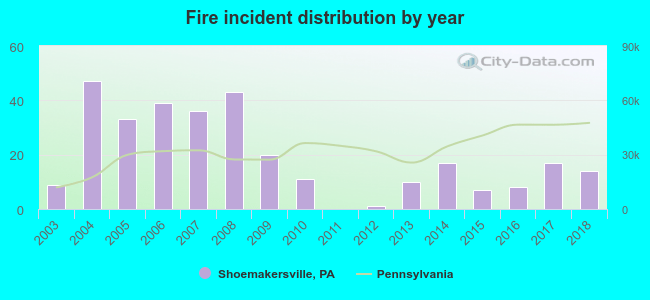 Based on the data from the years 2003 - 2018 the average number of fire incidents per year is 20. The highest number of reported fires - 47 took place in 2004, and the least - 0 in 2011. The data has a growing trend.
 32.7% incidents where reported in the morning and 67.3% in the evening. The most fires (20.2%) took place on Monday, and the least (10.6%) on Thursday.
 Based on the 312 fire incident reports from years 2003 - 2018 most fires (11.5%) took place during July, and the least (4.5%) in September.
 Out of all 490 cases reported during the years 2003 - 2018, the most belonged to the categories: Fire (63.7%), Rescue & EMS (20.6%), and Overpressure Rupture (5.3%).
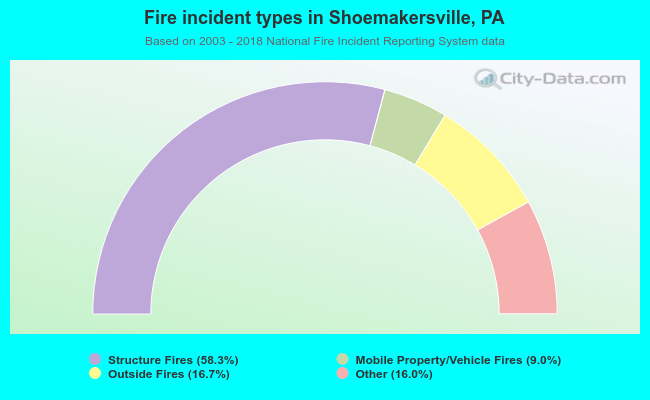 When looking into fire subcategories, the most incidents belonged to: Structure Fires (58.3%), and Outside Fires (16.7%).