| Fire incidents reported |
|---|
| Sreet name | Count |
|---|
| MERIDIAN ST | 14 | | SHIRLEY RD | 8 | | STATE ROAD 234 | 8 | | 1125 RD | 6 | | FIRST ST | 6 | | GRANT CITY RD | 6 | | PENNSYLVANIA | 6 | | ST RD 234 | 6 | | STATE ROAD 109 | 6 | | WHITE ST | 6 | | 100 RD | 4 | | 400 N | 4 | | 650 | 4 | | 9164 EAST 900 NORTH | 4 | | 950 RD | 4 | | ALABAMA ST | 4 | | I-70 | 4 | | MAIN ST | 4 | | MECHANICSBURG RD | 4 | | NEW JERSEY | 4 | | NEW JERSEY ST | 4 | | PENNSYLVANIA ST | 4 | | SOUTH RAILROAD ST | 4 | | WALNUT ST | 4 | | WHITE ST | 4 |
| | | Fire incidents reported |
|---|
| Sreet name | Count |
|---|
| 0-I-70 111 MILE ??MAR | 2 | | 100 LEE STREET | 2 | | 100 S. | 2 | | 1000 RD | 2 | | 1050 E | 2 | | 10664 EAST SR ??234 | 2 | | 10664 EAST ST. RD 234 | 2 | | 1100 | 2 | | 1100 RD | 2 | | 1100 ST | 2 | | 1125 | 2 | | 11585 E. 700 N. | 2 | | 11737 EAST 650 NORTH | 2 | | 11825 EAST 1100 NORTH | 2 | | 11873 E. ST. RD. 234 | 2 | | 11873 EAST SR ??234 | 2 | | 11979 EAST 900 NORTH | 2 | | 1200 E | 2 | | 1200 E. | 2 | | 1200 N | 2 | | 1200 RD | 2 | | 121 ALABAMA | 2 | | 137 MERIDIAN STREET | 2 | | 1400 N. CADIZ PIKE | 2 | | |
|
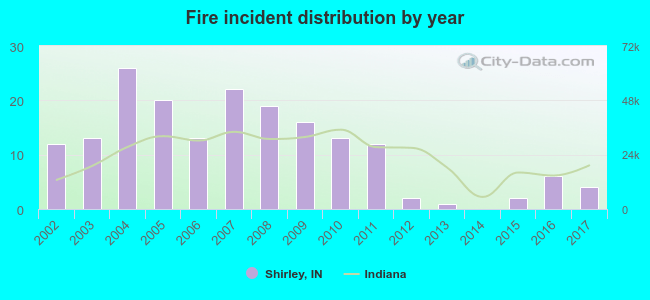 According to the data from the years 2002 - 2017 the average number of fires per year is 11. The highest number of fires - 26 took place in 2004, and the least - 0 in 2014. The data has a dropping trend.
 33.1% incidents where reported in the morning and 66.9% in the evening. The most fires (18.2%) took place on Monday, and the least (10.5%) on Friday.
 According to the 181 fire incident reports from years 2002 - 2017 most fires (14.4%) took place during January, and the least (4.4%) in February.
 Out of all 590 cases reported during the years 2002 - 2017, the most belonged to the categories: Overpressure Rupture (51.7%), Fire (30.7%), and Rescue & EMS (5.1%).
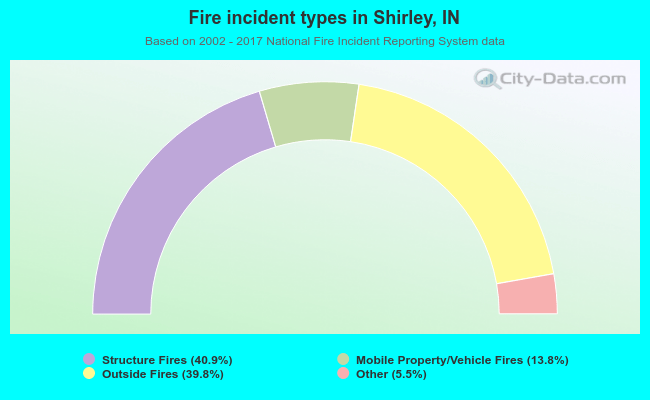 When looking into fire subcategories, the most reports belonged to: Structure Fires (40.9%), and Outside Fires (39.8%).