Shippenville: Fire Incidents, Pennsylvania (PA)
Where are fire incidents reported in Shippenville, PA
Something went wrong! Please refresh the page.
|
| |||||||||||||||||||||||||||||||||||||||||||||||||||||||||||||||||||||||||||||||||
| Other | 17 | |||||||||||||||||||||||||||||||||||||||||||||||||||||||||||||||||||||||||||||||||
2003 - 2018 National Fire Incident Reporting System (NFIRS) incidents
- Incident types reported to NFIRS in Shippenville, PA
- 12544.6%Fire
- 7225.7%Hazardous Condition
- 3111.1%Rescue & EMS
- 207.1%Service Call
- 176.1%Good Intent Call
- 145.0%False Alarm
- 10.4%Severe Weather
- Fire incident types reported to NFIRS in Shippenville, PA
- 8164.8%Structure Fires
- 2520.0%Outside Fires
- 118.8%Other
- 86.4%Mobile Property/Vehicle Fires
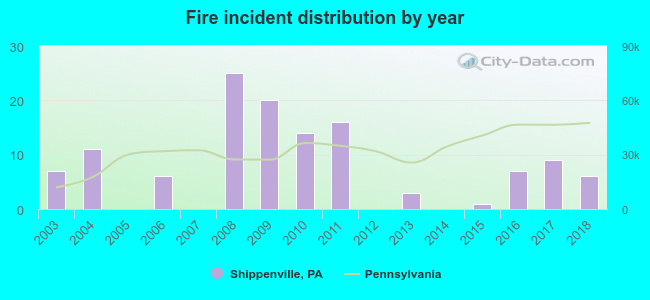 Based on the data from the years 2003 - 2018 the average number of fire incidents per year is 8. The highest number of reported fires - 25 took place in 2008, and the least - 0 in 2005. The data has a dropping trend.
 32.0% incidents where reported in the morning and 68.0% in the evening. The most fires (17.6%) took place on Friday, and the least (7.2%) on Tuesday.
 Based on the 125 fire incident reports from years 2003 - 2018 most fires (12.0%) took place during January, and the least (4.0%) in October.
 Out of all 280 cases reported during the years 2003 - 2018, the most belonged to the categories: Fire (44.6%), Rescue & EMS (25.7%), and Overpressure Rupture (11.1%).
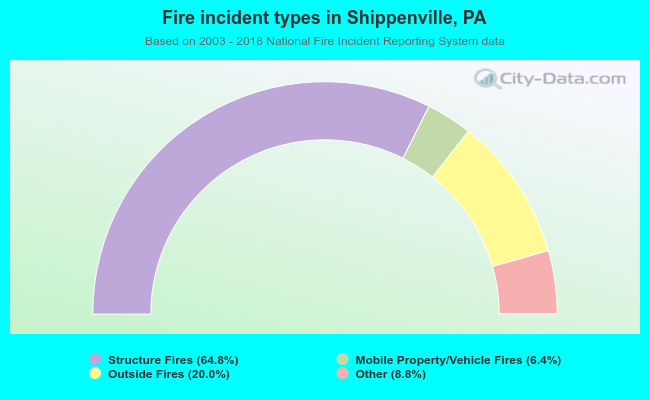 When looking into fire subcategories, the most incidents belonged to: Structure Fires (64.8%), and Outside Fires (20.0%).