| Fire incidents reported |
|---|
| Sreet name | Count |
|---|
| JAMES RIVER RD | 28 | | LAUREL RD | 14 | | BROWNINGS CV | 10 | | KEYS CHURCH RD | 10 | | MONTREAL LN | 8 | | ROCKFISH RIVER RD | 8 | | RYAN CIR | 6 | | WHEELERS COVE ROAD | 6 | | WILDWOOD LN | 6 | | 743 MANN LN | 4 | | CHURCH ST | 4 | | CRAIGTOWN RD | 4 | | FINDLEY GAP DR | 4 | | GLADE RD | 4 | | HILLTOP LANE LN | 4 | | NORWOOD RD | 4 | | WHEELERS COVE RD | 4 | | WILLIAMSTOWN RD | 4 | | 100 DOWDY DR | 2 | | 10246 JAMES RIVER RD | 2 | | 105 RYAN CIR | 2 | | 105 RYAN CIRCLE | 2 | | 105 RYAN'S CIR | 2 | | 105 RYANS CIR | 2 | | 1126 BROWNING CV | 2 |
| | | Fire incidents reported |
|---|
| Sreet name | Count |
|---|
| 1136 BROWNINGS COVE | 2 | | 1136 BROWNINGS CV | 2 | | 114 BROWNINGS COVE ROAD | 2 | | 1200 FINLEY MOUNTAIN | 2 | | 12767 JAMES RIVER RD | 2 | | 129 VILLAGE RD | 2 | | 129 VILLAGE ROAD | 2 | | 1364 BROWNINGS COVE ROAD | 2 | | 1566 HIGH PEAK LN | 2 | | 1671 DAVIS CREEK LN | 2 | | 175 FINDLEY MOUNTAIN RD | 2 | | 1755 VARIETY MILLS RD | 2 | | 179 SNOW HILL LN | 2 | | 180 RED APPLE ORCH | 2 | | 183 THOMAS MOUNTAIN TRAIL | 2 | | 190 HILL TOP LN | 2 | | 208 MANN LN | 2 | | 209 BROWNING'S CV | 2 | | 212 WOODSON LN | 2 | | 230 WILDWOOD LN | 2 | | 241 MARETTA LN | 2 | | 2808 GLADE RD | 2 | | 303 WILLOUGHBY LANE | 2 | | 321 JAMES RIVER RD | 2 | | 322 STAGEBRIDGE ROAD | 2 |
|
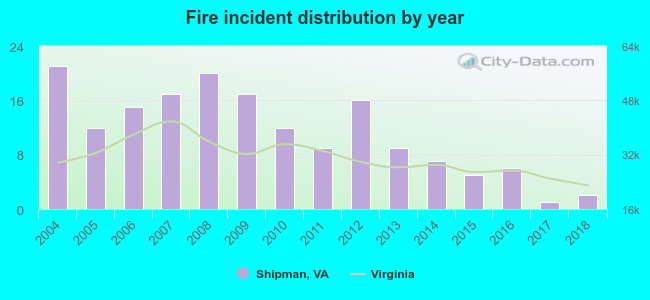 Based on the data from the years 2004 - 2018 the average number of fires per year is 11. The highest number of reported fire incidents - 21 took place in 2004, and the least - 1 in 2017. The data has a declining trend.
 23.7% incidents where reported in the morning and 76.3% in the evening. The most fires (21.3%) took place on Monday, and the least (9.5%) on Tuesday.
 According to the 169 fires from years 2004 - 2018 most fires (18.9%) took place during February, and the least (3.0%) in September.
 Out of all 307 cases reported during the years 2004 - 2018, the most belonged to the categories: Fire (55.0%), Service Call (16.0%), and Rescue & EMS (11.4%).
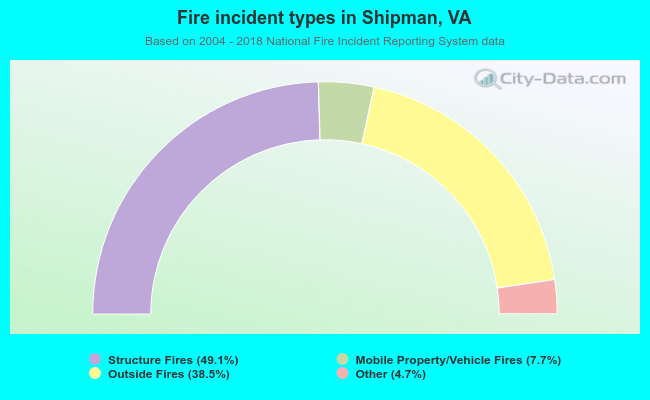 When looking into fire subcategories, the most reports belonged to: Structure Fires (49.1%), and Outside Fires (38.5%).