Shipman: Fire Incidents, Illinois (IL)
Where are fire incidents reported in Shipman, IL
Something went wrong! Please refresh the page.
|
| |||||||||||||||||||||||||||||||||||||||||||||||||||||||||||||||||||||||||||||||||||||||||||||||||||||||||||||
2002 - 2018 National Fire Incident Reporting System (NFIRS) incidents
- Incident types reported to NFIRS in Shipman, IL
- 10344.6%Fire
- 10143.7%Rescue & EMS
- 104.3%Good Intent Call
- 73.0%Hazardous Condition
- 73.0%Service Call
- 10.4%Overpressure Rupture
- 10.4%False Alarm
- 10.4%Severe Weather
- Fire incident types reported to NFIRS in Shipman, IL
- 5452.4%Structure Fires
- 3836.9%Outside Fires
- 87.8%Mobile Property/Vehicle Fires
- 32.9%Other
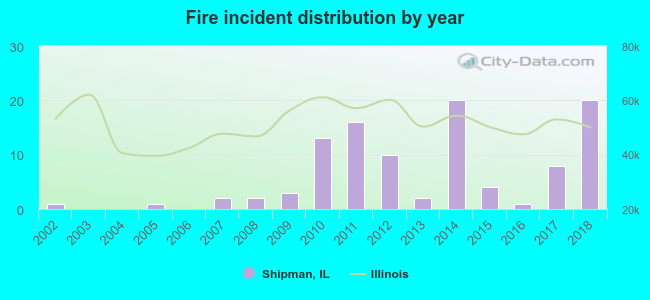 Based on the data from the years 2002 - 2018 the average number of fire incidents per year is 6. The highest number of fires - 20 took place in 2014, and the least - 0 in 2003. The data has an increasing trend.
 29.1% incidents where reported in the morning and 70.9% in the evening. The most fires (23.3%) took place on Saturday, and the least (6.8%) on Thursday.
 According to the 103 incident reports from years 2002 - 2018 most fires (14.6%) took place during July, and the least (1.0%) in August.
 Out of all 231 cases reported during the years 2002 - 2018, the most belonged to the categories: Fire (44.6%), Rescue & EMS (43.7%), and Good Intent Call (4.3%).
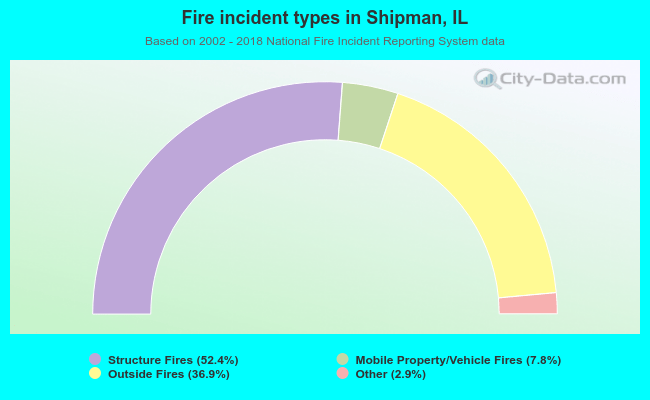 When looking into fire subcategories, the most reports belonged to: Structure Fires (52.4%), and Outside Fires (36.9%).