| Fire incidents reported |
|---|
| Sreet name | Count |
|---|
| 1606 320TH ST | 8 | | 1745 270TH ST | 6 | | US 67 | 6 | | 1532 255TH ST. | 4 | | 1546 255TH ST | 4 | | 170TH AVENUE | 4 | | 270 ST | 4 | | 2847 155TH AVE | 4 | | 310TH STREET | 4 | | 3171 175TH AVE | 4 | | 3195 MEADOW GATE RD | 4 | | 320TH STREET | 4 | | 3RD STREET | 4 | | 63RD STREET | 4 | | 646 SUNCREST DR | 4 | | 646 SUNCREST DRIVE | 4 | | 7510 176TH AVE. | 4 | | ISLAND VIEW DRIVE | 4 | | KNOXVILLE ROAD | 4 | | MEADOW GATE RD | 4 | | 00000 | 2 | | 101 E. 1ST ST. | 2 | | 103 EAST 6TH AVE. | 2 | | 103 EAST 6TH ST | 2 | | 104 FYRE LAKE DRIVE | 2 |
| | | Fire incidents reported |
|---|
| Sreet name | Count |
|---|
| 106 6TH ST | 2 | | 106 6TH STREET | 2 | | 106TH AVE | 2 | | 108 W. 6TH ST. | 2 | | 1201 ISLAND VIEW | 2 | | 1201 ISLAND VIEW DR | 2 | | 1248 ISLAND VIEW DR | 2 | | 1248 ISLAND VIEW DRIVE LGTS | 2 | | 1348 US 67 | 2 | | 1348 US HWY 67 | 2 | | 1381 300TH ST | 2 | | 1384 265TH ST ST | 2 | | 1384 265TH STREET | 2 | | 1385 300TH ST | 2 | | 139 FRYE LAKE DR | 2 | | 139 FYRE LAKE DRIVE | 2 | | 1395 MEDOW GATE RD | 2 | | 1412 CAMPBELL DR | 2 | | 1418 320TH ST | 2 | | 1422 300TH ST | 2 | | 1430 WOODLAND DR | 2 | | 14394 302 ST | 2 | | 1451 277TH ST | 2 | | 1451 277TH STREET | 2 | | |
|
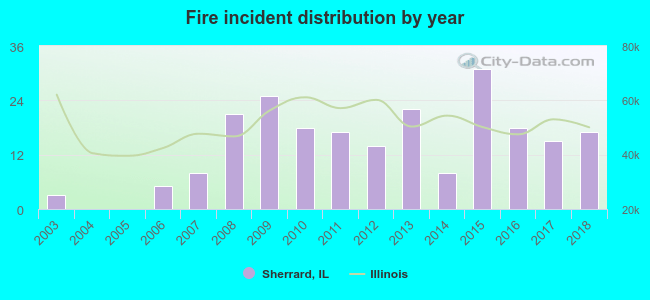 Based on the data from the years 2003 - 2018 the average number of fire incidents per year is 14. The highest number of fires - 31 took place in 2015, and the least - 0 in 2004. The data has an increasing trend.
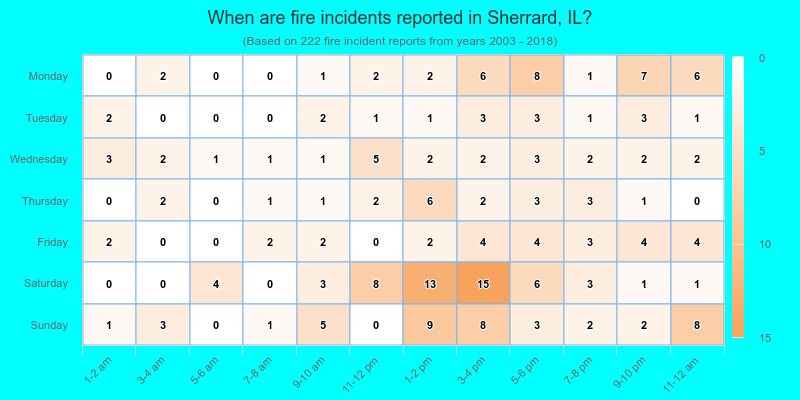
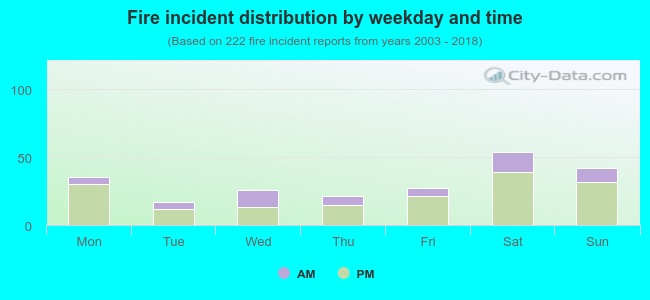 27.0% incidents where reported in the morning and 73.0% in the evening. The most fires (24.3%) took place on Saturday, and the least (7.7%) on Tuesday.
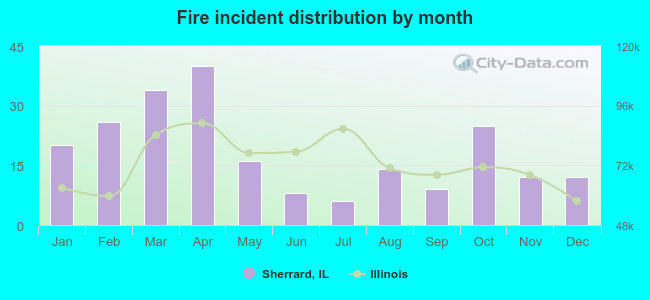 According to the 222 incident reports from years 2003 - 2018 most fires (18.0%) took place during April, and the least (2.7%) in July.
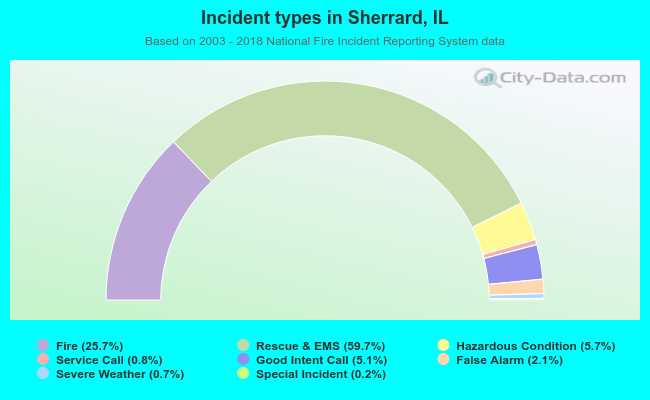 Out of all 864 cases reported during the years 2003 - 2018, the most belonged to the categories: Overpressure Rupture (59.7%), Fire (25.7%), and Rescue & EMS (5.7%).
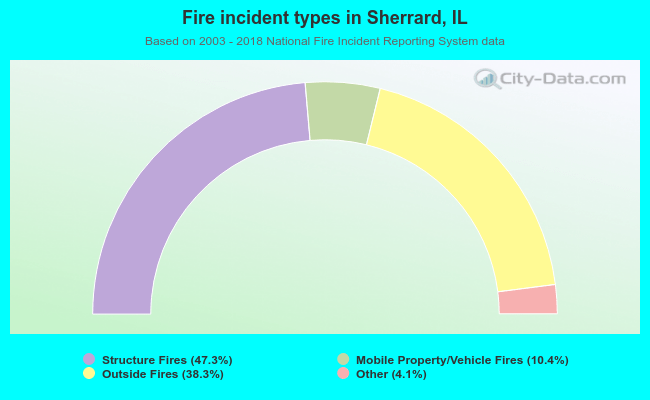 When looking into fire subcategories, the most reports belonged to: Structure Fires (47.3%), and Outside Fires (38.3%).