Sheridan: Fire Incidents, Indiana (IN)
Where are fire incidents reported in Sheridan, IN
Something went wrong! Please refresh the page.
|
| |||||||||||||||||||||||||||||||||||||||||||||||||||||||||||||||||||||||||||||||||||||||||||||||||||||||||||||
2002 - 2018 National Fire Incident Reporting System (NFIRS) incidents
- Incident types reported to NFIRS in Sheridan, IN
- 69137.3%Fire
- 64935.0%Rescue & EMS
- 1849.9%Good Intent Call
- 1819.8%Hazardous Condition
- 995.3%Service Call
- 402.2%False Alarm
- 100.5%Special Incident
- Fire incident types reported to NFIRS in Sheridan, IN
- 30343.8%Outside Fires
- 23934.6%Structure Fires
- 9613.9%Mobile Property/Vehicle Fires
- 537.7%Other
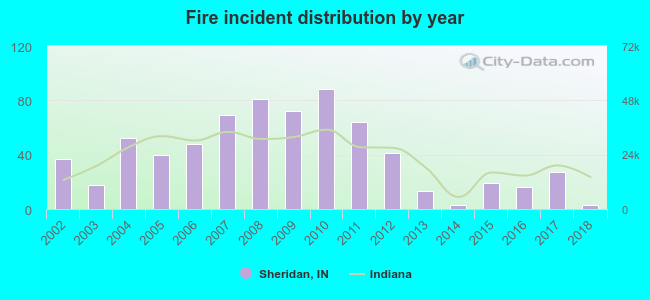 According to the data from the years 2002 - 2018 the average number of fires per year is 41. The highest number of fires - 88 took place in 2010, and the least - 3 in 2014. The data has a dropping trend.
 The median response time based on all reported fire incidents is 8 minutes. This is higher than the state median value.
The median response time in Sheridan, IN compared to nearest cities:
(Note: Based on data for all years, including only cities with at least 500 fire incidents)
| Sheridan: | 8 minutes |
| Westfield: | 7 minutes |
| Noblesville: | 6 minutes |
| Carmel: | 6 minutes |
| Zionsville: | 6 minutes |
| Tipton: | 5 minutes |
| Lebanon: | 5 minutes |
| Fishers: | 6 minutes |
| Frankfort: | 6 minutes |
 26.3% incidents where reported in the morning and 73.7% in the evening. The most fires (16.5%) took place on Saturday, and the least (11.9%) on Tuesday.
 According to the 691 reports from years 2002 - 2018 most fires (11.9%) took place during October, and the least (5.2%) in January.
 Out of all 1,855 cases reported during the years 2002 - 2018, the most belonged to the categories: Fire (37.3%), Overpressure Rupture (35.0%), and Service Call (9.9%).
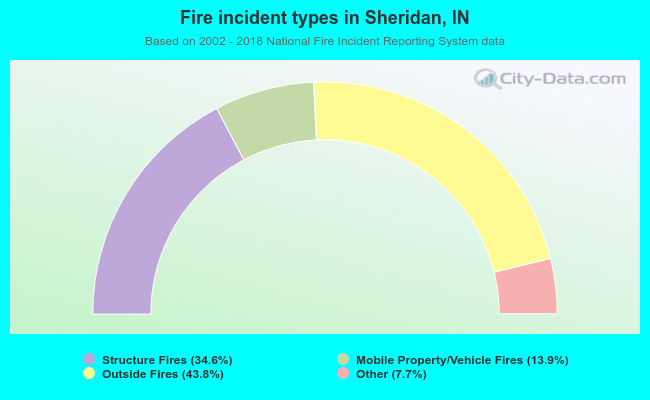 When looking into fire subcategories, the most reports belonged to: Outside Fires (43.8%), and Structure Fires (34.6%).