Shenandoah: Fire Incidents, Pennsylvania (PA)
Where are fire incidents reported in Shenandoah, PA
Something went wrong! Please refresh the page.
|
| |||||||||||||||||||||||||||||||||||||||||||||||||||||||||||||||||||||||||||||||||||||||||||||||||||||||||||||
2003 - 2018 National Fire Incident Reporting System (NFIRS) incidents
- Incident types reported to NFIRS in Shenandoah, PA
- 31827.5%Fire
- 22919.8%Hazardous Condition
- 16514.3%Good Intent Call
- 14212.3%Rescue & EMS
- 11810.2%Special Incident
- 958.2%False Alarm
- 786.7%Service Call
- 80.7%Severe Weather
- 30.3%Overpressure Rupture
- Fire incident types reported to NFIRS in Shenandoah, PA
- 24276.1%Structure Fires
- 5417.0%Outside Fires
- 123.8%Other
- 103.1%Mobile Property/Vehicle Fires
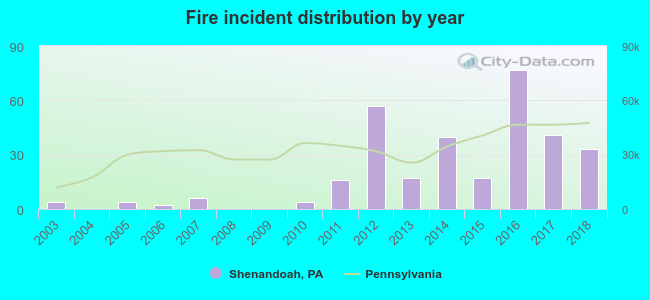 According to the data from the years 2003 - 2018 the average number of fires per year is 20. The highest number of fire incidents - 77 took place in 2016, and the least - 0 in 2004. The data has an increasing trend.
 Based on the data from the years 2003 - 2018 the average number of fire-related yearly casualties is 0. The highest number of injuries - 3 took place in 2012, and the lowest - 0 in 2003. The data has a growing trend.
 47.5% incidents where reported in the morning and 52.5% in the evening. The most fires (22.6%) took place on Sunday, and the least (7.9%) on Monday.
 Based on the 318 reports from years 2003 - 2018 most fires (12.3%) took place during May, and the least (4.4%) in December.
 Out of all 1,156 cases reported during the years 2003 - 2018, the most belonged to the categories: Fire (27.5%), Hazardous Condition (19.8%), and Good Intent Call (14.3%).
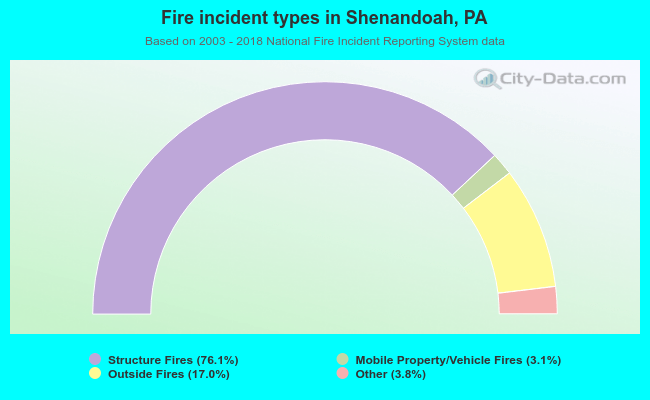 When looking into fire subcategories, the most reports belonged to: Structure Fires (76.1%), and Outside Fires (17.0%).