| Fire incidents reported |
|---|
| Sreet name | Count |
|---|
| 16503 ELK DRIVE | 4 | | CTY RD VV | 4 | | N1130 PIONEER RD | 4 | | N2173 MARKET RD | 4 | | N241 CTY HWY VV | 4 | | N7935 SPUR RD | 4 | | W6943 CTY RD D | 4 | | 13919 CTH D | 2 | | 14080SPUR RD | 2 | | 1434 CEMETERY RD | 2 | | 15880 PEACEFUL AVE | 2 | | 28203 CTY HWY M | 2 | | 28806 370 AVE | 2 | | 28806 370TH AV | 2 | | 29614 CTY RD V V | 2 | | 29614 HWY VV | 2 | | 30122 CTY RD VV | 2 | | 32317 305TH AVE | 2 | | 32563 CTY HWY M | 2 | | 33153 280TY AVE | 2 | | 33249 275 AVE | 2 | | 33451 275TH ST | 2 | | 33451 CTYM | 2 | | 33646 CTY M | 2 | | 36767 CTY M | 2 |
| | | Fire incidents reported |
|---|
| Sreet name | Count |
|---|
| 9584 TABER DR | 2 | | 9584TABER DR | 2 | | AHLERS DRIVE | 2 | | BEACH DRIVE | 2 | | BROKEN ARROW ROAD | 2 | | BUCKHORN RD | 2 | | CEMETERY RD | 2 | | CEMETERY RD AND SWAMP RD | 2 | | COPPER ROAD | 2 | | COUNTY HWY G | 2 | | COUNTY ROAD V | 2 | | CTY D | 2 | | CTY D CTY G | 2 | | CTY G AND BROKEN ARROW | 2 | | CTY HIGHWAY H | 2 | | CTY HWY V V CEMETERY RD | 2 | | CTY RD | 2 | | CTY RD V | 2 | | CTY V VAND MARSHALL RD | 2 | | DEAR AVE | 2 | | DEAR AVE | 2 | | DOWNTOWN SHELDON | 2 | | HAMMEN ST LOT8 | 2 | | HILLCREEK AND SPUR RD | 2 | | HWY 124 | 2 |
|
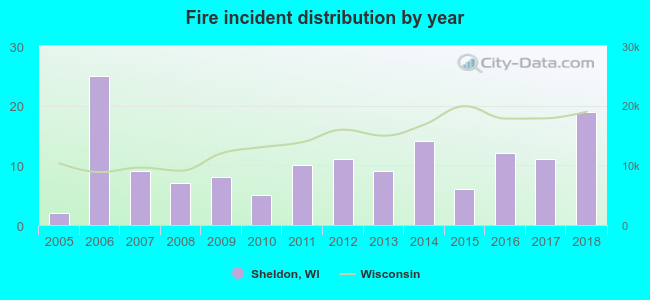 Based on the data from the years 2005 - 2018 the average number of fires per year is 11. The highest number of fire incidents - 25 took place in 2006, and the least - 2 in 2005. The data has a growing trend.
 35.1% incidents where reported in the morning and 64.9% in the evening. The most fires (23.0%) took place on Tuesday, and the least (8.1%) on Friday.
 Based on the 148 fire incidents from years 2005 - 2018 most fires (12.8%) took place during January, and the least (4.7%) in September.
 Out of all 235 cases reported during the years 2005 - 2018, the most belonged to the categories: Fire (63.0%), Overpressure Rupture (20.9%), and Service Call (5.5%).
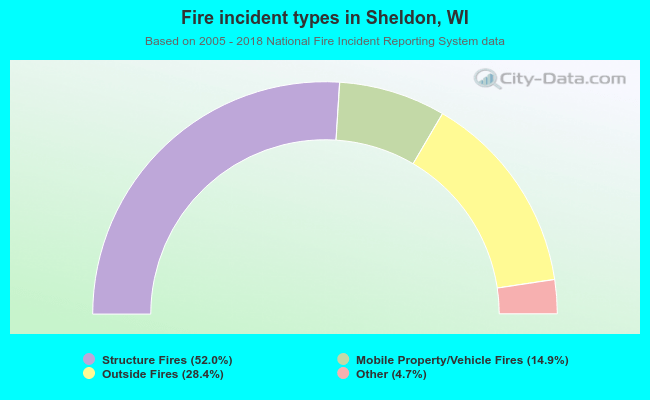 When looking into fire subcategories, the most reports belonged to: Structure Fires (52.0%), and Outside Fires (28.4%).