Shelby: Fire Incidents, Nebraska (NE)
Where are fire incidents reported in Shelby, NE
Something went wrong! Please refresh the page.
|
| |||||||||||||||||||||||||||||||||||||||||||||||||||||||||||||||||||||||||||||||||||||||||||||||||||||||||||||
| Other | 6 | |||||||||||||||||||||||||||||||||||||||||||||||||||||||||||||||||||||||||||||||||||||||||||||||||||||||||||||
2002 - 2018 National Fire Incident Reporting System (NFIRS) incidents
- Incident types reported to NFIRS in Shelby, NE
- 14545.7%Rescue & EMS
- 13241.6%Fire
- 144.4%Hazardous Condition
- 113.5%Good Intent Call
- 103.2%Service Call
- 41.3%Severe Weather
- 10.3%Overpressure Rupture
- Fire incident types reported to NFIRS in Shelby, NE
- 7456.1%Outside Fires
- 3728.0%Structure Fires
- 1712.9%Mobile Property/Vehicle Fires
- 43.0%Other
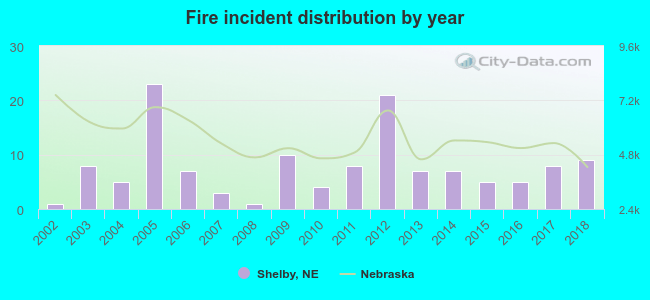 Based on the data from the years 2002 - 2018 the average number of fire incidents per year is 8. The highest number of fires - 23 took place in 2005, and the least - 1 in 2002. The data has an increasing trend.
 27.3% incidents where reported in the morning and 72.7% in the evening. The most fires (17.4%) took place on Monday, and the least (12.1%) on Wednesday.
 Based on the 132 fire incidents from years 2002 - 2018 most fires (12.1%) took place during May, and the least (2.3%) in February.
 Out of all 317 cases reported during the years 2002 - 2018, the most belonged to the categories: Rescue & EMS (45.7%), Fire (41.6%), and Hazardous Condition (4.4%).
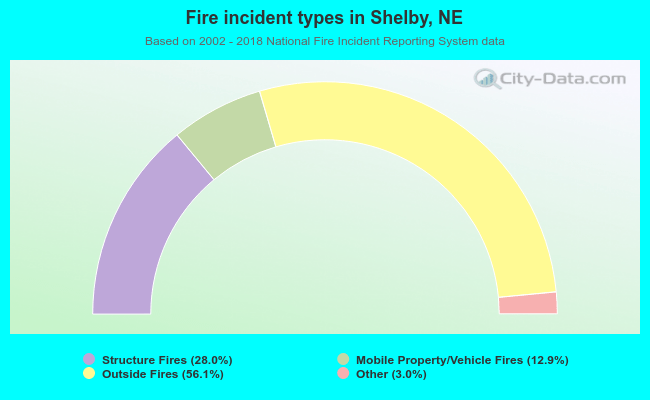 When looking into fire subcategories, the most reports belonged to: Outside Fires (56.1%), and Structure Fires (28.0%).