Shartlesville: Fire Incidents, Pennsylvania (PA)
Where are fire incidents reported in Shartlesville, PA
Something went wrong! Please refresh the page.
|
| |||||||||||||||||||||||||||||||||||||||||||||||||||||||||||||||||||||||||||||||||||||||||||||||||
2003 - 2018 National Fire Incident Reporting System (NFIRS) incidents
- Incident types reported to NFIRS in Shartlesville, PA
- 10152.9%Fire
- 3719.4%Rescue & EMS
- 2111.0%Good Intent Call
- 189.4%Hazardous Condition
- 105.2%Service Call
- 42.1%False Alarm
- Fire incident types reported to NFIRS in Shartlesville, PA
- 5756.4%Structure Fires
- 2221.8%Outside Fires
- 1918.8%Mobile Property/Vehicle Fires
- 33.0%Other
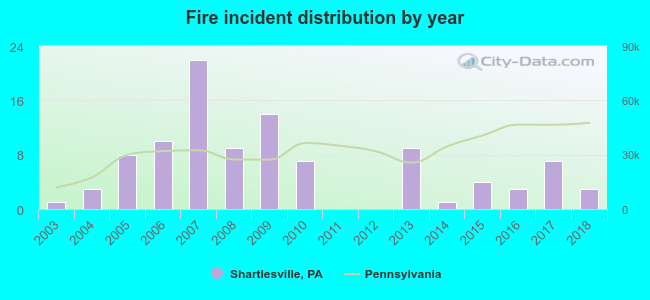 According to the data from the years 2003 - 2018 the average number of fires per year is 6. The highest number of fire incidents - 22 took place in 2007, and the least - 0 in 2011. The data has an increasing trend.
 38.6% incidents where reported in the morning and 61.4% in the evening. The most fires (19.8%) took place on Saturday, and the least (5.9%) on Thursday.
 Based on the 101 fires from years 2003 - 2018 most fires (12.9%) took place during May, and the least (4.0%) in February.
 Out of all 191 cases reported during the years 2003 - 2018, the most belonged to the categories: Fire (52.9%), Overpressure Rupture (19.4%), and Service Call (11.0%).
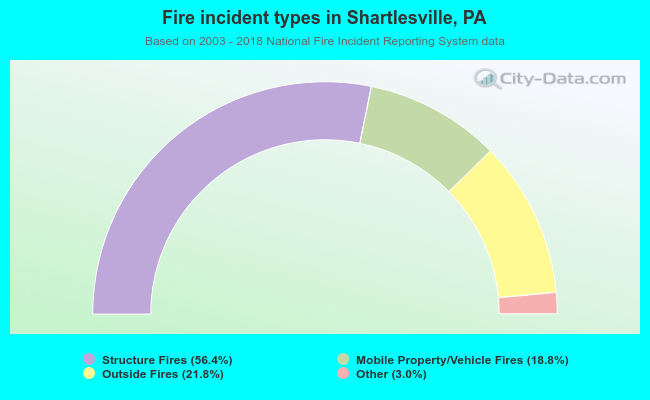 When looking into fire subcategories, the most reports belonged to: Structure Fires (56.4%), and Outside Fires (21.8%).