Sharon Hill: Fire Incidents, Pennsylvania (PA)
Where are fire incidents reported in Sharon Hill, PA
Something went wrong! Please refresh the page.
|
| |||||||||||||||||||||||||||||||||||||||||||||||||||||||||||||||||||||||||||||||||||||||||||||||||||||||||||||
2003 - 2018 National Fire Incident Reporting System (NFIRS) incidents
- Incident types reported to NFIRS in Sharon Hill, PA
- 35529.3%Fire
- 26922.2%False Alarm
- 26822.1%Good Intent Call
- 23019.0%Hazardous Condition
- 453.7%Rescue & EMS
- 292.4%Service Call
- 151.2%Special Incident
- Fire incident types reported to NFIRS in Sharon Hill, PA
- 27878.3%Structure Fires
- 349.6%Outside Fires
- 329.0%Other
- 113.1%Mobile Property/Vehicle Fires
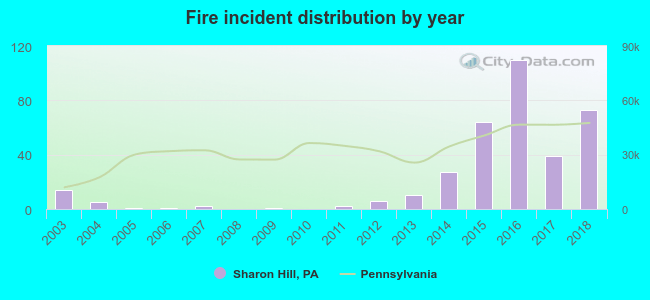 According to the data from the years 2003 - 2018 the average number of fires per year is 22. The highest number of fire incidents - 110 took place in 2016, and the least - 0 in 2008. The data has an increasing trend.
The average number of yearly fire incidents per 10k residents in Sharon Hill, PA compared to nearest cities:
(Note: Based on data for the last 3 years, including only cities with population 5,000 and above)
| Sharon Hill: | 129.7 |
| Collingdale: | 61.4 |
| Darby Township: | 6.2 |
| Folcroft: | 66.3 |
| Darby: | 116.6 |
| Glenolden: | 98.5 |
| Norwood: | 35.0 |
| Clifton Heights: | 46.0 |
| Yeadon: | 98.3 |

 30.7% incidents where reported in the morning and 69.3% in the evening. The most fires (18.3%) took place on Tuesday, and the least (9.6%) on Wednesday.
 Based on the 355 fires from years 2003 - 2018 most fires (10.7%) took place during April, and the least (6.2%) in November.
 Out of all 1,212 cases reported during the years 2003 - 2018, the most belonged to the categories: Fire (29.3%), False Alarm (22.2%), and Good Intent Call (22.1%).
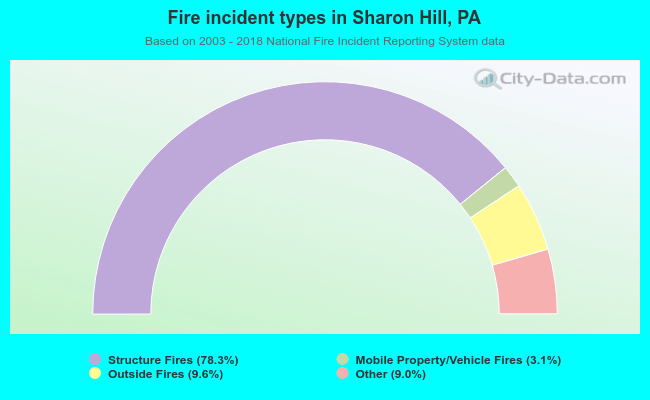 When looking into fire subcategories, the most reports belonged to: Structure Fires (78.3%), and Outside Fires (9.6%).