Shalimar: Fire Incidents, Florida (FL)
Where are fire incidents reported in Shalimar, FL
Something went wrong! Please refresh the page.
|
| |||||||||||||||||||||||||||||||||||||||||||||||||||||||||||||||||||||||||||||||||||||||||||||||||||||||||||||
2002 - 2018 National Fire Incident Reporting System (NFIRS) incidents
- Incident types reported to NFIRS in Shalimar, FL
- 3,70063.4%Rescue & EMS
- 64511.0%Good Intent Call
- 5289.0%Service Call
- 3736.4%Fire
- 3315.7%Hazardous Condition
- 2534.3%False Alarm
- 60.1%Severe Weather
- Fire incident types reported to NFIRS in Shalimar, FL
- 19351.7%Structure Fires
- 8623.1%Outside Fires
- 6417.2%Mobile Property/Vehicle Fires
- 308.0%Other
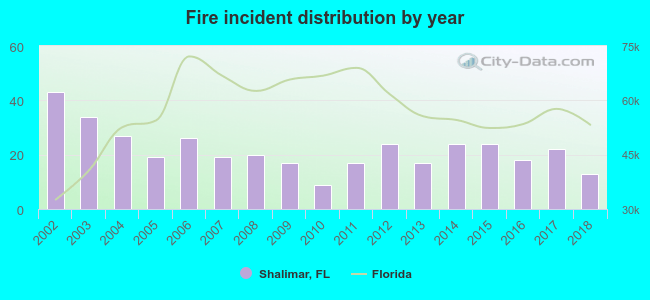 According to the data from the years 2002 - 2018 the average number of fires per year is 22. The highest number of reported fire incidents - 43 took place in 2002, and the least - 9 in 2010. The data has a decreasing trend.
 Based on the data from the years 2002 - 2018 the average number of fire-related casualties per year is 1. The highest number of casualties - 2 took place in 2002, and the lowest - 0 in 2004. The data has a decreasing trend.
 30.3% incidents where reported in the morning and 69.7% in the evening. The most fires (18.5%) took place on Saturday, and the least (8.8%) on Thursday.
 Based on the 373 fires from years 2002 - 2018 most fires (12.1%) took place during January, and the least (3.5%) in September.
 Out of all 5,840 cases reported during the years 2002 - 2018, the most belonged to the categories: Rescue & EMS (63.4%), Good Intent Call (11.0%), and Service Call (9.0%).
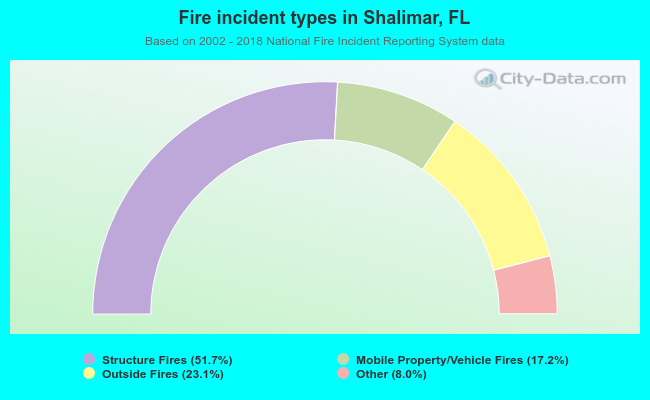 When looking into fire subcategories, the most incidents belonged to: Structure Fires (51.7%), and Outside Fires (23.1%).