Shadyside: Fire Incidents, Ohio (OH)
Where are fire incidents reported in Shadyside, OH
Something went wrong! Please refresh the page.
|
| |||||||||||||||||||||||||||||||||||||||||||||||||||||||||||||||||||||||||||||||||||||||||||||||||||||||||||||
2002 - 2018 National Fire Incident Reporting System (NFIRS) incidents
- Incident types reported to NFIRS in Shadyside, OH
- 1,13850.7%Rescue & EMS
- 46720.8%Fire
- 29513.1%Hazardous Condition
- 1637.3%Good Intent Call
- 1305.8%Service Call
- 401.8%False Alarm
- 40.2%Overpressure Rupture
- 40.2%Severe Weather
- 30.1%Special Incident
- Fire incident types reported to NFIRS in Shadyside, OH
- 24652.7%Structure Fires
- 15433.0%Outside Fires
- 6614.1%Mobile Property/Vehicle Fires
- 10.2%Other
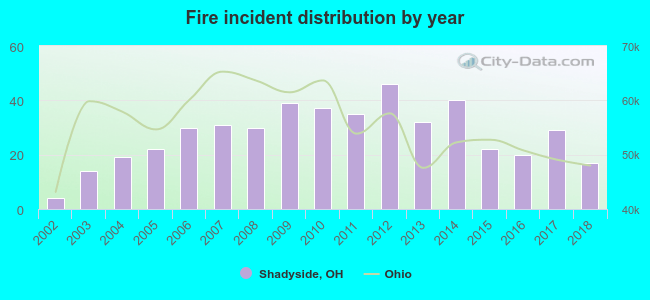 Based on the data from the years 2002 - 2018 the average number of fire incidents per year is 27. The highest number of fire incidents - 46 took place in 2012, and the least - 4 in 2002. The data has a rising trend.
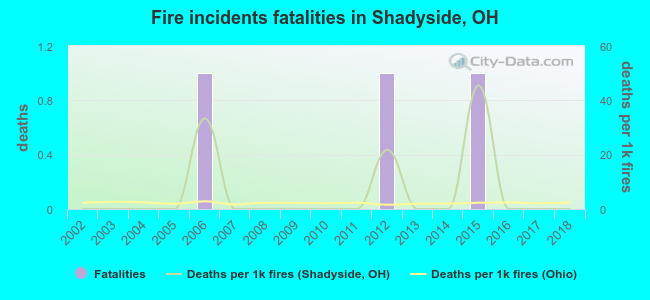 According to the reports from the years 2002 - 2018 the average number of fire-related yearly deaths is 0. The highest number of deaths - 1 took place in 2006, and the lowest - 0 in 2002. The data has a constant trend.
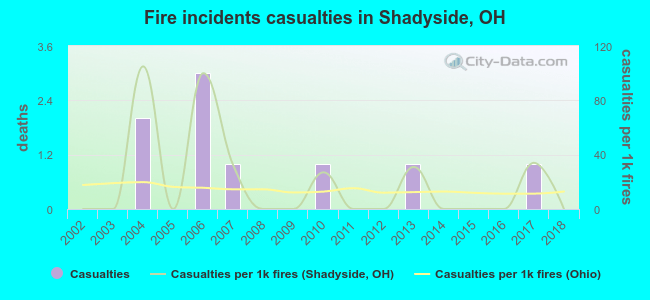 Based on the reports from the years 2002 - 2018 the average number of fire-related casualties per year is 1. The highest number of reported injuries - 3 took place in 2006, and the lowest - 0 in 2002. The data has a constant trend.
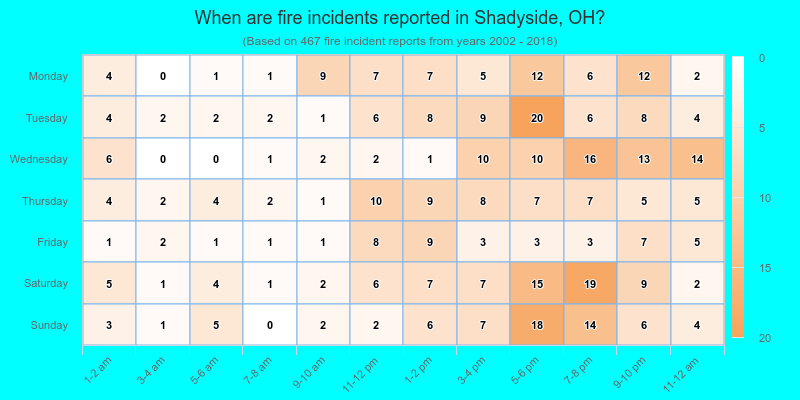
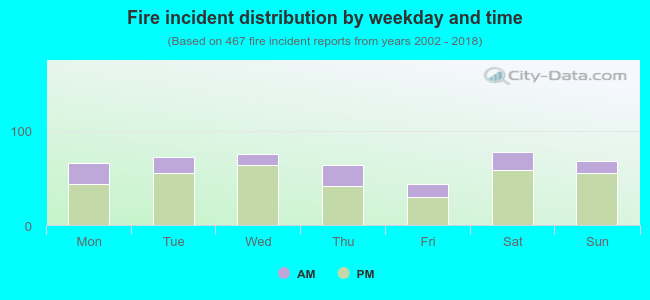 25.5% incidents where reported in the morning and 74.5% in the evening. The most fires (16.7%) took place on Saturday, and the least (9.4%) on Friday.
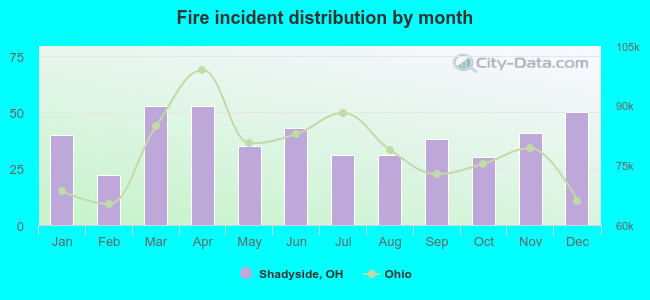 According to the 467 fire incidents from years 2002 - 2018 most fires (11.3%) took place during March, and the least (4.7%) in February.
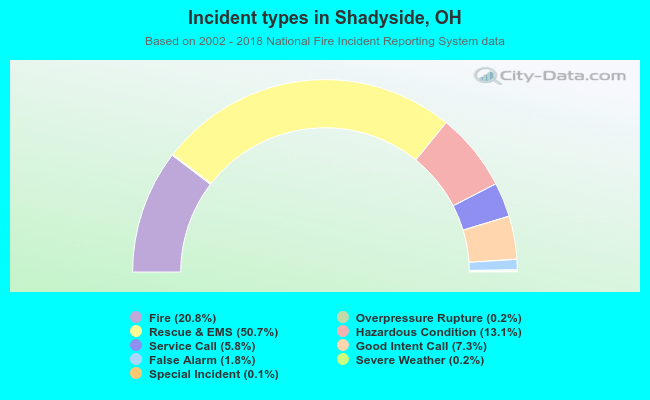 Out of all 2,244 cases reported during the years 2002 - 2018, the most belonged to the categories: Rescue & EMS (50.7%), Fire (20.8%), and Hazardous Condition (13.1%).
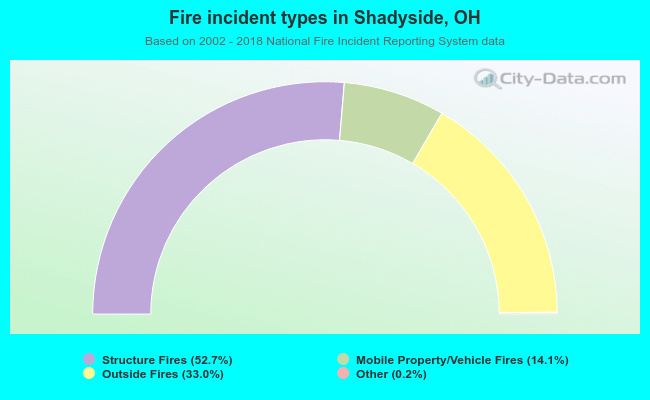 When looking into fire subcategories, the most incidents belonged to: Structure Fires (52.7%), and Outside Fires (33.0%).