Seymour: Fire Incidents, Wisconsin (WI)
Where are fire incidents reported in Seymour, WI
Something went wrong! Please refresh the page.
|
| |||||||||||||||||||||||||||||||||||||||||||||||||||||||||||||||||||||||||||||||||||||||||||||||||||||||||||||
| Other | 18 | |||||||||||||||||||||||||||||||||||||||||||||||||||||||||||||||||||||||||||||||||||||||||||||||||||||||||||||
2004 - 2018 National Fire Incident Reporting System (NFIRS) incidents
- Incident types reported to NFIRS in Seymour, WI
- 32830.3%Hazardous Condition
- 29627.4%Fire
- 16715.4%Rescue & EMS
- 15514.3%False Alarm
- 958.8%Good Intent Call
- 232.1%Service Call
- 121.1%Severe Weather
- 40.4%Special Incident
- 20.2%Overpressure Rupture
- Fire incident types reported to NFIRS in Seymour, WI
- 16455.4%Structure Fires
- 7625.7%Outside Fires
- 3311.1%Mobile Property/Vehicle Fires
- 237.8%Other
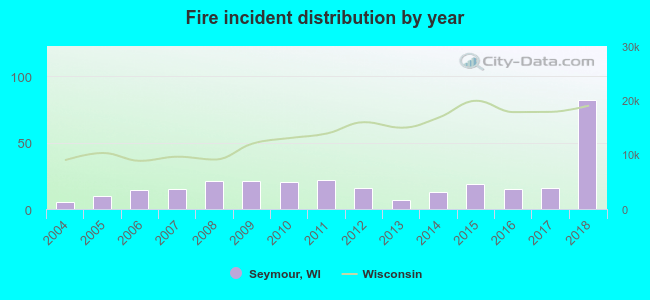 According to the data from the years 2004 - 2018 the average number of fire incidents per year is 20. The highest number of reported fire incidents - 82 took place in 2018, and the least - 5 in 2004. The data has a rising trend.
 35.1% incidents where reported in the morning and 64.9% in the evening. The most fires (17.2%) took place on Sunday, and the least (11.8%) on Wednesday.
 Based on the 296 fire incidents from years 2004 - 2018 most fires (11.1%) took place during December, and the least (4.1%) in February.
 Out of all 1,082 cases reported during the years 2004 - 2018, the most belonged to the categories: Hazardous Condition (30.3%), Fire (27.4%), and Rescue & EMS (15.4%).
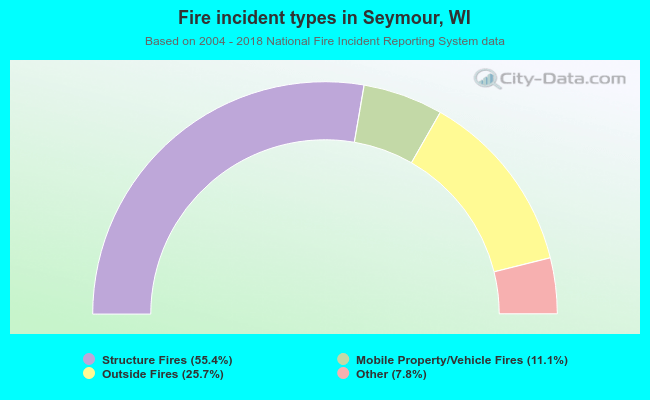 When looking into fire subcategories, the most incidents belonged to: Structure Fires (55.4%), and Outside Fires (25.7%).