| Fire incidents reported |
|---|
| Sreet name | Count |
|---|
| I-72 EXPY | 10 | | 0E RD | 4 | | 1400N RD | 4 | | 1600N 300E | 4 | | 200 E | 4 | | 300E RD | 4 | | 350 E CR 1400 N | 4 | | CENTER | 4 | | SHERMAN | 4 | | W CENTER | 4 | | & RT 47 INTERSECTION | 2 | | 0 E | 2 | | 1 MILE NORTH OF SEYMOUR | 2 | | 1/2 MILE WEST OF TOWN ALONG RR | 2 | | 1000N CR 350E | 2 | | 101 N. GRANT ST. | 2 | | 106 S SHERMAN | 2 | | 1100 | 2 | | 1100N | 2 | | 1200N 150E | 2 | | 1250 E | 2 | | 1300 N | 2 | | 1300N 274E | 2 | | 1343 | 2 | | 1372 TREASURE LN | 2 |
| | | Fire incidents reported |
|---|
| Sreet name | Count |
|---|
| 1400 N 300E | 2 | | 1400 NORTH ROAD | 2 | | 1400N | 2 | | 1400N 200E | 2 | | 1436 E2275 N | 2 | | 1500E | 2 | | 1500N | 2 | | 1500N 229E | 2 | | 150E1675N RD | 2 | | 1550 NORTH RD | 2 | | 1550N RD | 2 | | 1644 NORTH RD | 2 | | 1650 NORTH RD | 2 | | 1675 CR 250E | 2 | | 1675N 226E | 2 | | 1700 NORTH RD | 2 | | 2 MILES SOUTH OF SEYMOUR | 2 | | 200 E 1500 N | 2 | | 200 EAST RD | 2 | | 200E 1500N RD | 2 | | 200E RD | 2 | | 2250 N 1400 WEST | 2 | | 2290 CR 1520 E (PIATT CO) | 2 | | 2386 N 1500 E | 2 | | |
|
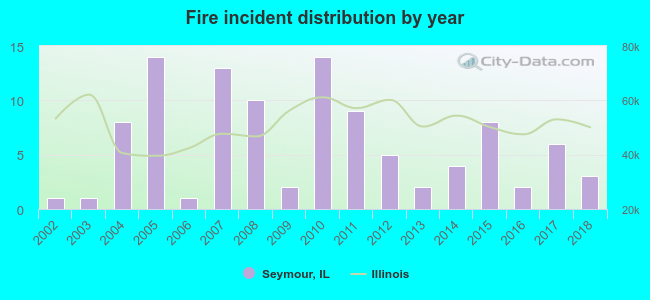 Based on the data from the years 2002 - 2018 the average number of fires per year is 6. The highest number of reported fires - 14 took place in 2005, and the least - 1 in 2002. The data has a rising trend.
 36.9% incidents where reported in the morning and 63.1% in the evening. The most fires (20.4%) took place on Tuesday, and the least (8.7%) on Monday.
 According to the 103 fires from years 2002 - 2018 most fires (13.6%) took place during May, and the least (1.9%) in February.
 Out of all 334 cases reported during the years 2002 - 2018, the most belonged to the categories: Overpressure Rupture (40.1%), Fire (30.8%), and Rescue & EMS (10.8%).
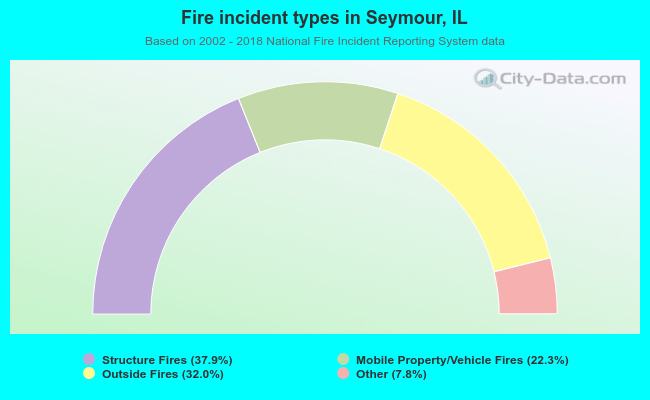 When looking into fire subcategories, the most reports belonged to: Structure Fires (37.9%), and Outside Fires (32.0%).