| Fire incidents reported |
|---|
| Sreet name | Count |
|---|
| I79 HWY | 24 | | I279 HWY | 12 | | BEAVER ST | 8 | | INTERSTATE 79 HWY | 8 | | OHIO RIVER BLVD | 8 | | PILGRIM DR | 8 | | BROAD ST | 6 | | CAMPMEETING RD | 6 | | CHESTNUT ST | 6 | | CONWAY WALLROSE RD | 6 | | MC ALEER ROAD RD | 6 | | THORN ST | 6 | | WATSON ST | 6 | | WEXFORD-BAYNE ROAD RD | 6 | | BIG SEWICKLEY CREEK RD | 4 | | BIG SEWICKLEY CREEK ROAD RD | 4 | | CONWAY-WALLROSE RD | 4 | | GEORGETOWN DRIVE DR | 4 | | GROVE ST | 4 | | HIGHVIEW DR | 4 | | KENNEY DR | 4 | | LOVETT LN | 4 | | MAIN ST | 4 | | MAPLE LANE | 4 | | MCDEVITT ROAD RD | 4 |
| | | Fire incidents reported |
|---|
| Sreet name | Count |
|---|
| MT NEBO ROAD | 4 | | ROCHESTER RD | 4 | | RUSTIC RIDGE DR | 4 | | STURBRIDGE DRIVE DR | 4 | | 11TH ST | 2 | | ACADEMY AVE | 2 | | AMSLER RD | 2 | | AMSLER RIDGE RD | 2 | | BACKBONE RD | 2 | | BEADNELL DR | 2 | | BEAVER STREET | 2 | | BELL FARM ESTATES | 2 | | BIG SEWICKLEY CREEK ROAD | 2 | | BIG SEWICKLEY CREEKEC RD | 2 | | BIGSEWICKLEY CREEK ROAD | 2 | | BLACKBURN HEIGHTS DR | 2 | | BLACKBURN HEIGHTS DRIVE DR | 2 | | BLACKBURN RD | 2 | | BLACKBURN ROAD | 2 | | BLOSSOM LANE | 2 | | BLOSSOM LN | 2 | | BOWER DR | 2 | | BRADSBERRY LANE LA | 2 | | CAMP MEETING EXT | 2 | | |
|
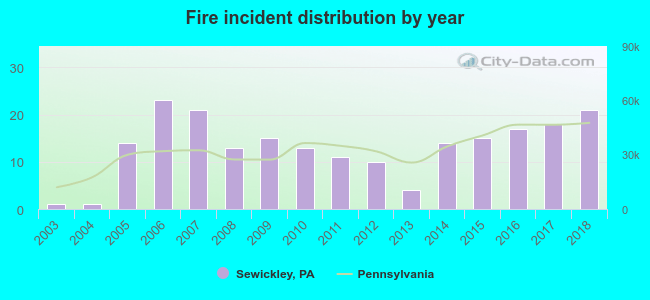 According to the data from the years 2003 - 2018 the average number of fires per year is 13. The highest number of fire incidents - 23 took place in 2006, and the least - 1 in 2003. The data has an increasing trend.
 28.4% incidents where reported in the morning and 71.6% in the evening. The most fires (18.5%) took place on Wednesday, and the least (7.6%) on Sunday.
 Based on the 211 fires from years 2003 - 2018 most fires (13.7%) took place during April, and the least (3.3%) in November.
 Out of all 1,569 cases reported during the years 2003 - 2018, the most belonged to the categories: Hazardous Condition (33.0%), False Alarm (23.1%), and Fire (13.4%).
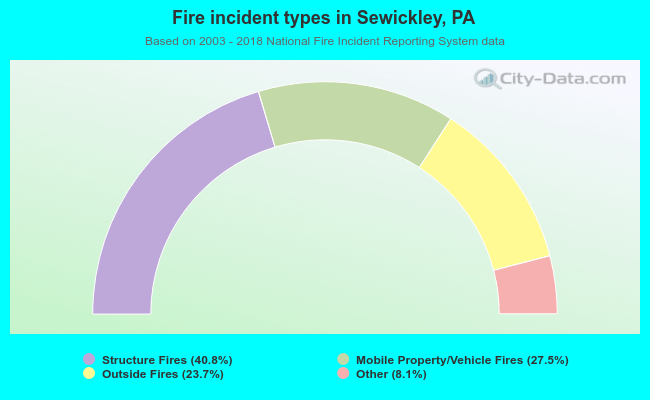 When looking into fire subcategories, the most reports belonged to: Structure Fires (40.8%), and Mobile Property/Vehicle Fires (27.5%).