| Fire incidents reported |
|---|
| Sreet name | Count |
|---|
| LAKE GEORGE RD | 38 | | US HWY 17 | 18 | | BUNNELL RD | 16 | | RAULERSON RD | 16 | | MCBRIDE RD | 12 | | CADE FERNERY RD | 6 | | COLUMBIA ST | 6 | | MCGLON RD | 6 | | PAULDING ST | 6 | | REGISTER LN | 6 | | AMELIA ST | 4 | | BARTON ST | 4 | | BROWN LEE RD | 4 | | CEMETERY RD | 4 | | COLUMBIA CT | 4 | | COWART RD | 4 | | NEW HOPE AV | 4 | | PREVATTE HOMESTEAD WAY | 4 | | ROBINSON LN | 4 | | TILLY BYRD RD | 4 | | TURKEY SHOOT RD | 4 | | VOLUSIAN FOREST TR | 4 | | 101 NEW HOPE VILLIAGE | 2 | | AMELIA STRE | 2 | | BENNETT RD | 2 |
| | | Fire incidents reported |
|---|
| Sreet name | Count |
|---|
| BROWNLEE RD | 2 | | CADE FERERY RD | 2 | | CHARDY FARMS RD | 2 | | CHERRY ST | 2 | | CHURCH ST | 2 | | COUNTY BOUNDARY | 2 | | CSX RR | 2 | | DUNCAN RD | 2 | | HAYWARD ST | 2 | | HIGHWAY 17 | 2 | | HWY 17 | 2 | | HWY 17 & PAULDING | 2 | | JOE PITTMAN RD | 2 | | LAKEVIEW DR | 2 | | LEMON RD | 2 | | LITTLE BROWN CHURCH RD | 2 | | MAYFIELD RD | 2 | | MCBRIDE RD & PETER R IX | 2 | | NEW HOPE | 2 | | PARK DR | 2 | | PAULDING RD | 2 | | PETERS RD | 2 | | PREVATT RD | 2 | | PRINCETON ST | 2 | | PURVIS RD | 2 |
|
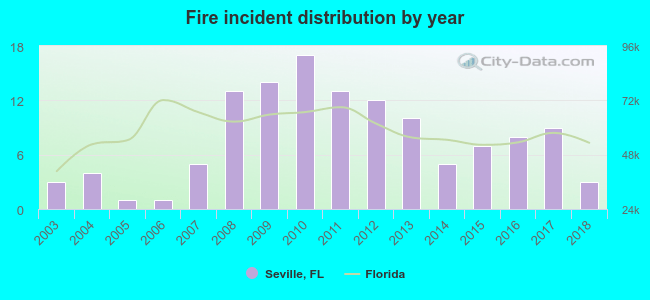 According to the data from the years 2003 - 2018 the average number of fires per year is 8. The highest number of reported fire incidents - 17 took place in 2010, and the least - 1 in 2005. The data has a constant trend.
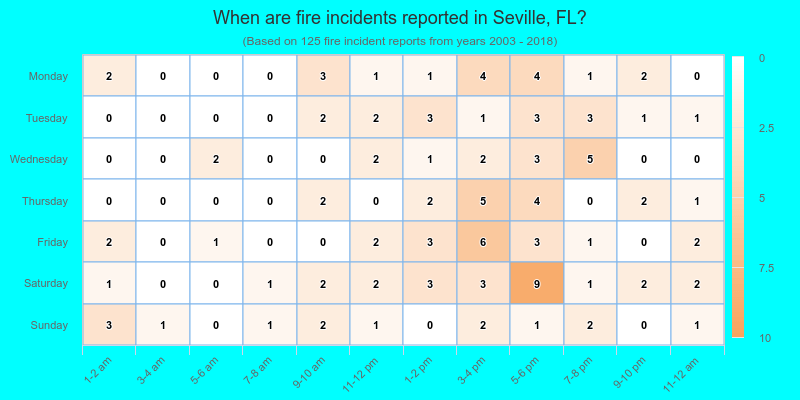
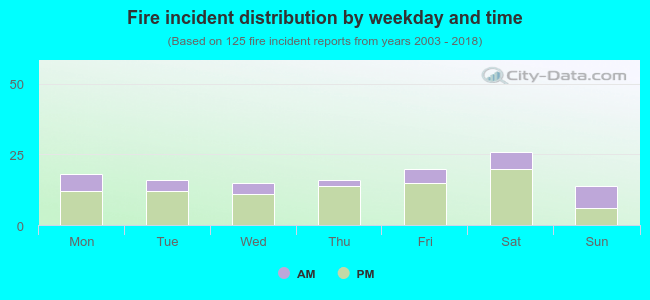 28.0% incidents where reported in the morning and 72.0% in the evening. The most fires (20.8%) took place on Saturday, and the least (11.2%) on Sunday.
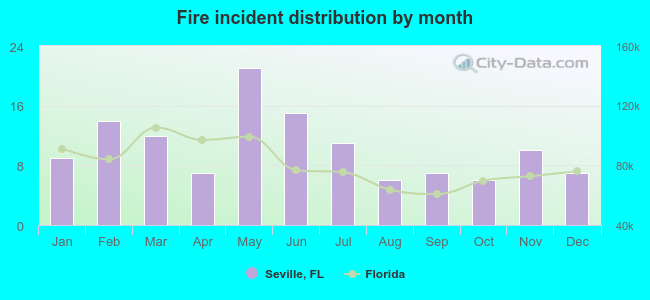 Based on the 125 fire incidents from years 2003 - 2018 most fires (16.8%) took place during May, and the least (4.8%) in August.
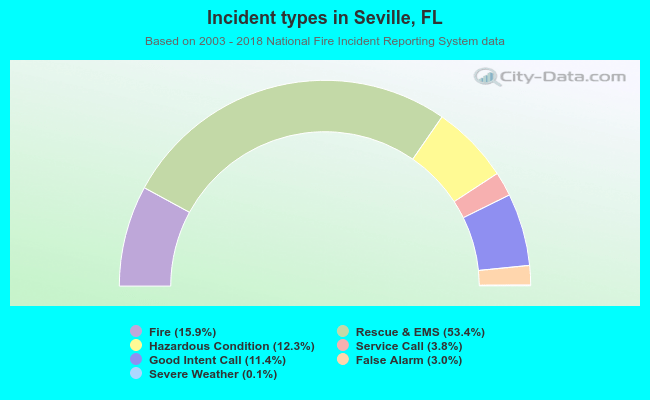 Out of all 788 cases reported during the years 2003 - 2018, the most belonged to the categories: Overpressure Rupture (53.4%), Fire (15.9%), and Rescue & EMS (12.3%).
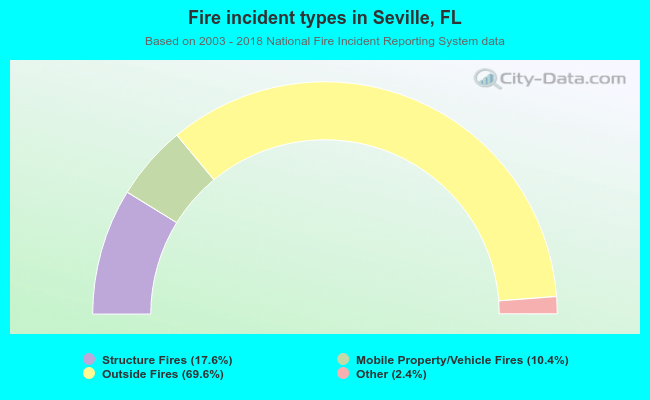 When looking into fire subcategories, the most incidents belonged to: Outside Fires (69.6%), and Structure Fires (17.6%).