Sebring: Fire Incidents, Florida (FL)
Where are fire incidents reported in Sebring, FL
Something went wrong! Please refresh the page.
| Fire incidents reported | |
|---|---|
| Sreet name | Count |
| US 27 HWY | 306 |
| LAKEVIEW DR | 192 |
| US 27 | 178 |
| KENILWORTH BLVD | 108 |
| SPARTA RD | 86 |
| RIDGEWOOD DR | 74 |
| QUAIL AVE | 72 |
| US 27 S | 64 |
| U.S. 27 HWY | 62 |
| ARBUCKLE CREEK RD | 54 |
| HIGHLANDS AVE | 52 |
| SUN N LAKE BLVD | 50 |
| OLIVE RD | 48 |
| SR 66 | 46 |
| LAKE JOSEPHINE DR | 44 |
| GRAND AVE | 42 |
| US 98 | 42 |
| COLUMBUS BLVD | 40 |
| HAMMOCK RD | 38 |
| MANATEE DR | 38 |
| US 27 N | 38 |
| CR 635 | 36 |
| MELADY AVE | 36 |
| US 27 SOUTH | 36 |
| GRANADA BLVD | 32 |
| VILLA RD | 32 |
| YOUTH CARE LN | 32 |
| DESOTO RD | 30 |
| LUCAS DR | 30 |
| ORANGE BLOSSOM AVE | 30 |
| Other | 2,107 |
2002 - 2018 National Fire Incident Reporting System (NFIRS) incidents
- Incident types reported to NFIRS in Sebring, FL
- 16,05058.4%Rescue & EMS
- 4,07514.8%Fire
- 2,2228.1%Good Intent Call
- 2,1717.9%Hazardous Condition
- 1,4955.4%Service Call
- 1,3524.9%False Alarm
- 970.4%Special Incident
- Fire incident types reported to NFIRS in Sebring, FL
- 2,07550.9%Outside Fires
- 1,28531.5%Structure Fires
- 49212.1%Mobile Property/Vehicle Fires
- 2235.5%Other
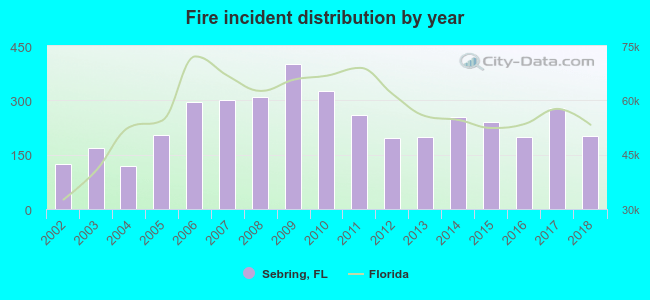 Based on the data from the years 2002 - 2018 the average number of fire incidents per year is 240. The highest number of fires - 401 took place in 2009, and the least - 118 in 2004. The data has an increasing trend.
The average number of yearly fire incidents per 10k residents in Sebring, FL compared to nearest cities:
(Note: Based on data for the last 3 years, including only cities with population 5,000 and above)
| Sebring: | 218.2 |
| Avon Park: | 131.8 |
| Fort Meade: | 156.2 |
| Lake Wales: | 156.1 |
| Arcadia: | 344.5 |
| Wahneta: | 5.9 |
| Bartow: | 82.0 |
| Winter Haven: | 100.1 |
| Okeechobee: | 455.0 |
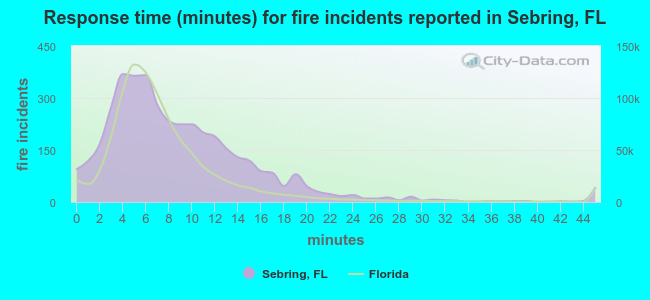 The median response time based on all reported fire incidents is 8 minutes. This is higher than the state median value.
The median response time in Sebring, FL compared to nearest cities:
(Note: Based on data for all years, including only cities with at least 500 fire incidents)
| Sebring: | 8 minutes |
| Avon Park: | 7 minutes |
| Lake Placid: | 11 minutes |
| Frostproof: | 11 minutes |
| Wauchula: | 7 minutes |
| Fort Meade: | 8 minutes |
| Lake Wales: | 8 minutes |
| Arcadia: | 7 minutes |
| Bartow: | 8 minutes |
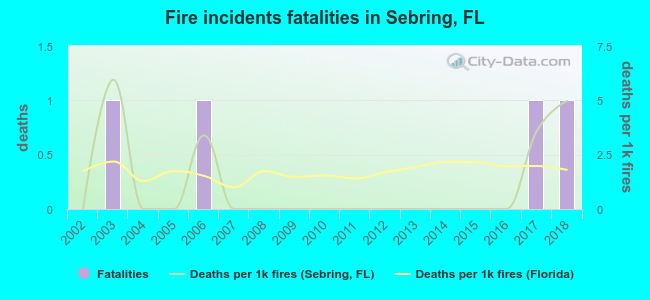 Based on the data from the years 2002 - 2018 the average number of fire-related yearly deaths is 0. The highest number of deaths - 1 took place in 2003, and the lowest - 0 in 2002. The data has a rising trend.
The average number of fatalities per 1,000 fires is 1. This indicator was the highest - 6 in 2003, and the lowest 0 in 2002. The trend for fatalities per 1,000 fire incidents is rising. Compared to the state value the number of fatalities per 1,000 fires is lower.
Based on the data from the years 2002 - 2018 the average number of fire-related yearly deaths is 0. The highest number of deaths - 1 took place in 2003, and the lowest - 0 in 2002. The data has a rising trend.
The average number of fatalities per 1,000 fires is 1. This indicator was the highest - 6 in 2003, and the lowest 0 in 2002. The trend for fatalities per 1,000 fire incidents is rising. Compared to the state value the number of fatalities per 1,000 fires is lower.Deaths per 1,000 incidents in Sebring, FL compared to nearest cities:
(Note: Based on data for all years, including only cities with at least 2,500 fire incidents)
| Sebring: | 1.0 |
| Lake Wales: | 1.9 |
| Arcadia: | 0.9 |
| Bartow: | 3.4 |
| Winter Haven: | 2.4 |
| Okeechobee: | 2.6 |
| Lakeland: | 2.0 |
| Port Charlotte: | 0.8 |
| North Port: | 0.6 |
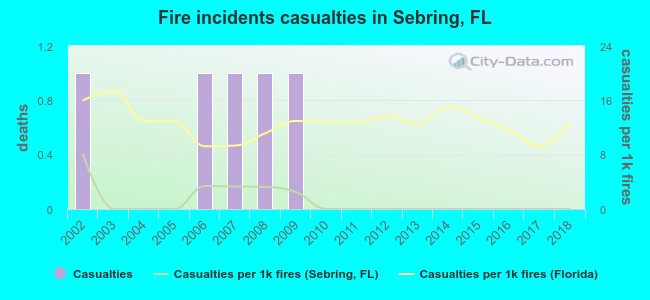 According to the data from the years 2002 - 2018 the average number of fire-related yearly casualties is 0. The highest number of reported injuries - 1 took place in 2002, and the lowest - 0 in 2003. The data has a decreasing trend.
The average number of casualties per 1,000 fire incidents is 1. This indicator was the highest - 8 in 2002, and the lowest 0 in 2003. The trend for casualties per 1,000 incidents is declining. Compared to the state value the number of injuries per 1,000 fire incidents is much lower.
According to the data from the years 2002 - 2018 the average number of fire-related yearly casualties is 0. The highest number of reported injuries - 1 took place in 2002, and the lowest - 0 in 2003. The data has a decreasing trend.
The average number of casualties per 1,000 fire incidents is 1. This indicator was the highest - 8 in 2002, and the lowest 0 in 2003. The trend for casualties per 1,000 incidents is declining. Compared to the state value the number of injuries per 1,000 fire incidents is much lower.Casualties per 1,000 incidents in Sebring, FL compared to nearest cities:
(Note: Based on data for all years, including only cities with at least 500 fire incidents)
| Sebring: | 1.2 |
| Avon Park: | 6.1 |
| Lake Placid: | 0.9 |
| Frostproof: | 4.9 |
| Wauchula: | 5.6 |
| Fort Meade: | 0.9 |
| Lake Wales: | 7.3 |
| Arcadia: | 3.1 |
| Bartow: | 9.0 |
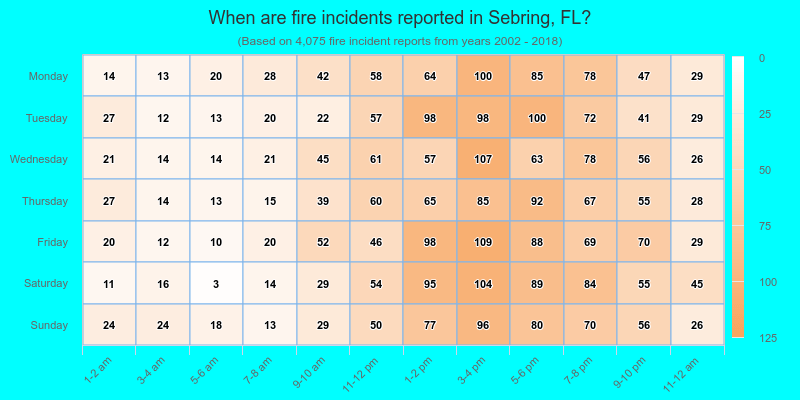
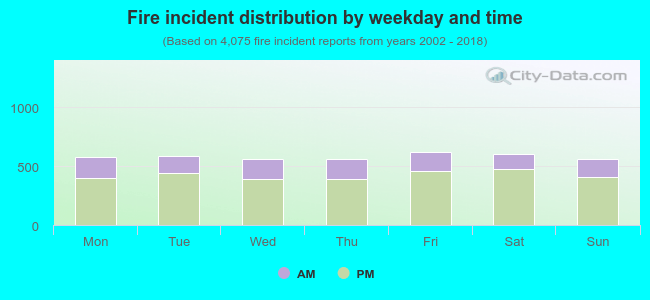 27.4% incidents where reported in the morning and 72.6% in the evening. The most fires (15.3%) took place on Friday, and the least (13.7%) on Thursday.
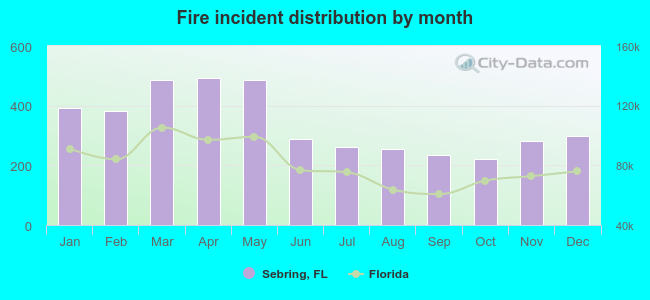 Based on the 4,075 fire incident reports from years 2002 - 2018 most fires (12.1%) took place during April, and the least (5.4%) in October.
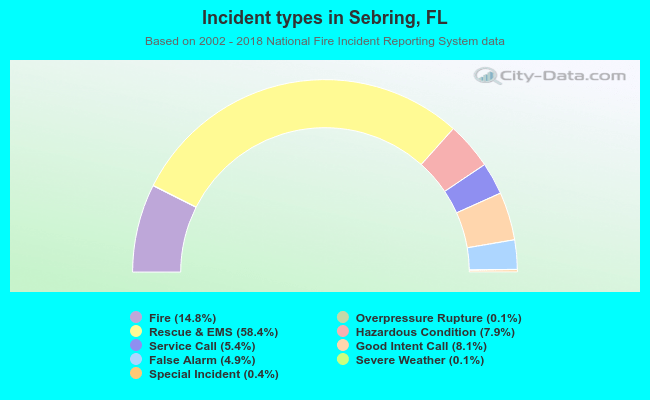 Out of all 27,501 cases reported during the years 2002 - 2018, the most belonged to the categories: Rescue & EMS (58.4%), Fire (14.8%), and Good Intent Call (8.1%).
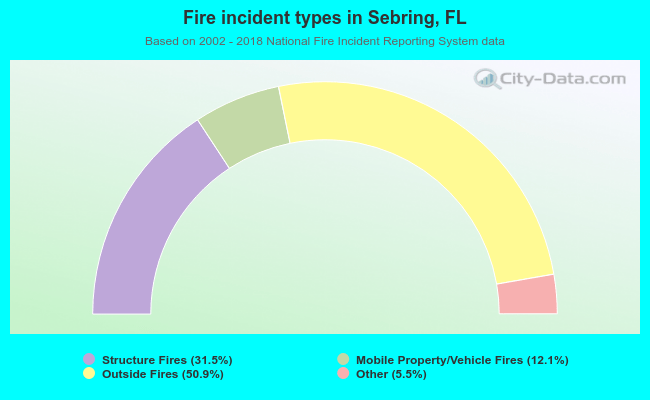 When looking into fire subcategories, the most reports belonged to: Outside Fires (50.9%), and Structure Fires (31.5%).