Seat Pleasant: Fire Incidents, Maryland (MD)
Where are fire incidents reported in Seat Pleasant, MD
Something went wrong! Please refresh the page.
|
| |||||||||||||||||||||||||||||||||||||||||||||||||||||||||||||||||||||||||||||||||||||||||||||||||||||||||||||
2009 - 2015 National Fire Incident Reporting System (NFIRS) incidents
- Incident types reported to NFIRS in Seat Pleasant, MD
- 39047.7%Fire
- 30337.0%Hazardous Condition
- 465.6%False Alarm
- 293.5%Rescue & EMS
- 273.3%Service Call
- 222.7%Good Intent Call
- 10.1%Severe Weather
- Fire incident types reported to NFIRS in Seat Pleasant, MD
- 16843.1%Structure Fires
- 9223.6%Mobile Property/Vehicle Fires
- 7017.9%Other
- 6015.4%Outside Fires
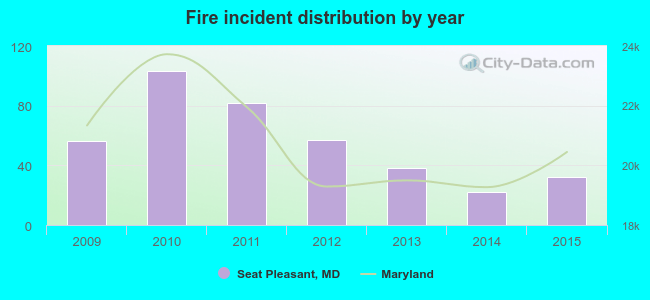 Based on the data from the years 2009 - 2015 the average number of fires per year is 56. The highest number of fires - 103 took place in 2010, and the least - 22 in 2014. The data has a dropping trend.
 Based on the data from the years 2009 - 2015 the average number of fire-related casualties per year is 1. The highest number of injuries - 3 took place in 2010, and the lowest - 0 in 2011. The data has a decreasing trend.
 39.5% incidents where reported in the morning and 60.5% in the evening. The most fires (17.7%) took place on Saturday, and the least (10.5%) on Monday.
 Based on the 390 fire incidents from years 2009 - 2015 most fires (12.1%) took place during May, and the least (3.3%) in November.
 Out of all 818 cases reported during the years 2009 - 2015, the most belonged to the categories: Fire (47.7%), Rescue & EMS (37.0%), and Good Intent Call (5.6%).
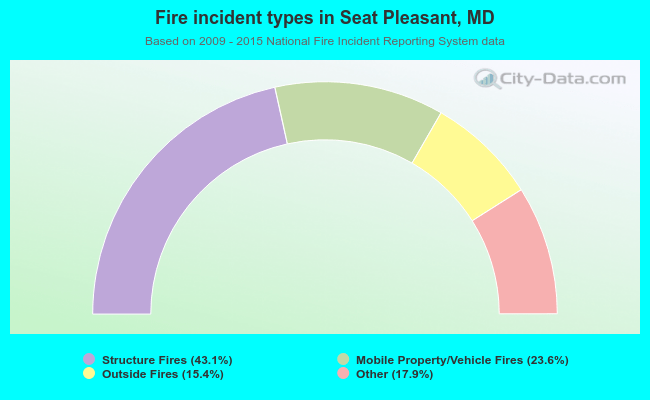 When looking into fire subcategories, the most reports belonged to: Structure Fires (43.1%), and Mobile Property/Vehicle Fires (23.6%).