Seaside Heights: Fire Incidents, New Jersey (NJ)
Where are fire incidents reported in Seaside Heights, NJ
Something went wrong! Please refresh the page.
|
| |||||||||||||||||||||||||||||||||||||||||||||||||||||||||||||||||||||||||||||||||||||||||||||||||||||||||||||
2002 - 2018 National Fire Incident Reporting System (NFIRS) incidents
- Incident types reported to NFIRS in Seaside Heights, NJ
- 54748.6%Hazardous Condition
- 28525.3%Fire
- 19517.3%False Alarm
- 454.0%Good Intent Call
- 232.0%Rescue & EMS
- 161.4%Service Call
- 80.7%Overpressure Rupture
- 40.4%Special Incident
- 20.2%Severe Weather
- Fire incident types reported to NFIRS in Seaside Heights, NJ
- 14249.8%Structure Fires
- 10336.1%Outside Fires
- 248.4%Mobile Property/Vehicle Fires
- 165.6%Other
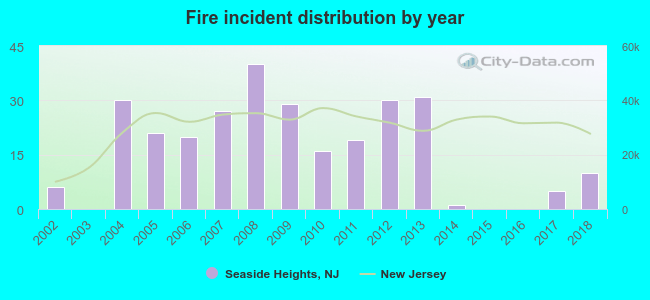 Based on the data from the years 2002 - 2018 the average number of fires per year is 17. The highest number of reported fires - 40 took place in 2008, and the least - 0 in 2003. The data has an increasing trend.
 42.1% incidents where reported in the morning and 57.9% in the evening. The most fires (18.9%) took place on Saturday, and the least (8.8%) on Wednesday.
 Based on the 285 fire incident reports from years 2002 - 2018 most fires (14.4%) took place during July, and the least (3.2%) in November.
 Out of all 1,125 cases reported during the years 2002 - 2018, the most belonged to the categories: Hazardous Condition (48.6%), Fire (25.3%), and False Alarm (17.3%).
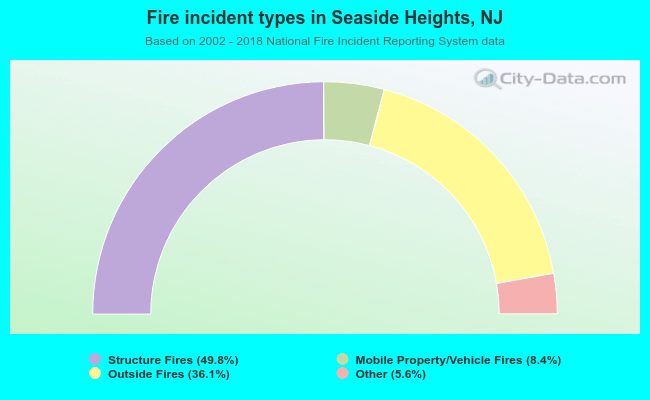 When looking into fire subcategories, the most reports belonged to: Structure Fires (49.8%), and Outside Fires (36.1%).