Schuylkill Haven: Fire Incidents, Pennsylvania (PA)
Where are fire incidents reported in Schuylkill Haven, PA
Something went wrong! Please refresh the page.
|
| |||||||||||||||||||||||||||||||||||||||||||||||||||||||||||||||||||||||||||||||||||||||||||||||||||||||||||||
2003 - 2018 National Fire Incident Reporting System (NFIRS) incidents
- Incident types reported to NFIRS in Schuylkill Haven, PA
- 48026.6%Hazardous Condition
- 47826.5%Fire
- 29316.2%Rescue & EMS
- 19110.6%Good Intent Call
- 1598.8%Service Call
- 1568.6%False Alarm
- 261.4%Severe Weather
- 181.0%Special Incident
- 60.3%Overpressure Rupture
- Fire incident types reported to NFIRS in Schuylkill Haven, PA
- 33469.9%Structure Fires
- 9219.2%Outside Fires
- 275.6%Mobile Property/Vehicle Fires
- 255.2%Other
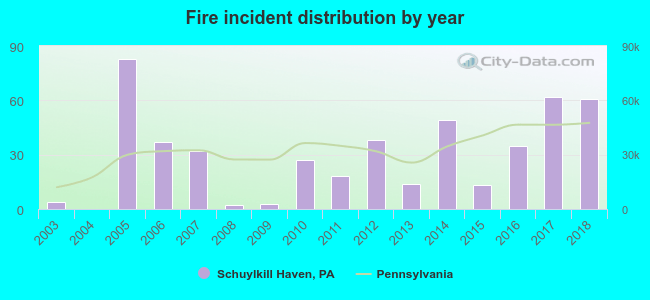 According to the data from the years 2003 - 2018 the average number of fire incidents per year is 30. The highest number of fires - 83 took place in 2005, and the least - 0 in 2004. The data has an increasing trend.
The average number of yearly fire incidents per 10k residents in Schuylkill Haven, PA compared to nearest cities:
(Note: Based on data for the last 3 years, including only cities with population 5,000 and above)
| Schuylkill Haven: | 99.7 |
| Pottsville: | 220.0 |
| Tamaqua: | 104.4 |
| Mount Carmel: | 32.8 |

 33.1% incidents where reported in the morning and 66.9% in the evening. The most fires (17.8%) took place on Thursday, and the least (10.7%) on Tuesday.
 According to the 478 fire incident reports from years 2003 - 2018 most fires (16.1%) took place during May, and the least (5.0%) in August.
 Out of all 1,807 cases reported during the years 2003 - 2018, the most belonged to the categories: Hazardous Condition (26.6%), Fire (26.5%), and Rescue & EMS (16.2%).
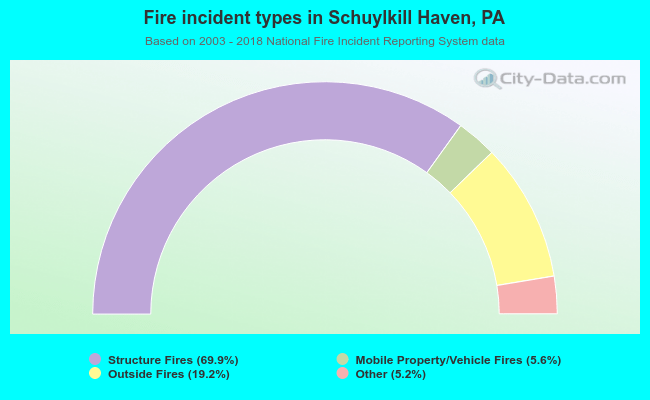 When looking into fire subcategories, the most incidents belonged to: Structure Fires (69.9%), and Outside Fires (19.2%).