Santa Clara: Fire Incidents, Utah (UT)
Where are fire incidents reported in Santa Clara, UT
Something went wrong! Please refresh the page.
|
| |||||||||||||||||||||||||||||||||||||||||||||||||||||||||||||||||||||||||||||||||||||||||||||||||||||||||||||
2002 - 2018 National Fire Incident Reporting System (NFIRS) incidents
- Incident types reported to NFIRS in Santa Clara, UT
- 1,45161.2%Rescue & EMS
- 30312.8%Good Intent Call
- 25910.9%Fire
- 1285.4%Hazardous Condition
- 1255.3%Service Call
- 713.0%False Alarm
- 170.7%Special Incident
- 140.6%Severe Weather
- 30.1%Overpressure Rupture
- Fire incident types reported to NFIRS in Santa Clara, UT
- 15961.4%Outside Fires
- 6625.5%Structure Fires
- 238.9%Mobile Property/Vehicle Fires
- 114.2%Other
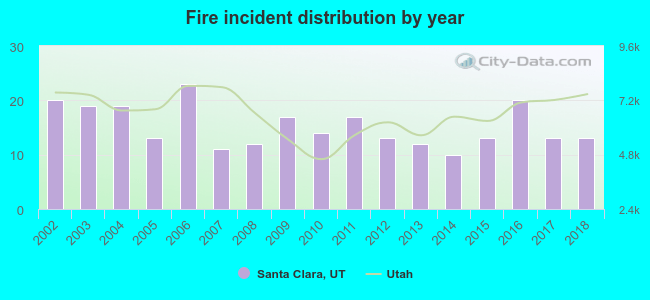 Based on the data from the years 2002 - 2018 the average number of fires per year is 15. The highest number of reported fire incidents - 23 took place in 2006, and the least - 10 in 2014. The data has a decreasing trend.
The average number of yearly fire incidents per 10k residents in Santa Clara, UT compared to nearest cities:
(Note: Based on data for the last 3 years, including only cities with population 5,000 and above)
| Santa Clara: | 23.0 |
| Ivins: | 24.8 |
| Washington: | 11.1 |
| Hurricane: | 43.5 |
| Cedar City: | 27.7 |
| Enoch: | 21.3 |
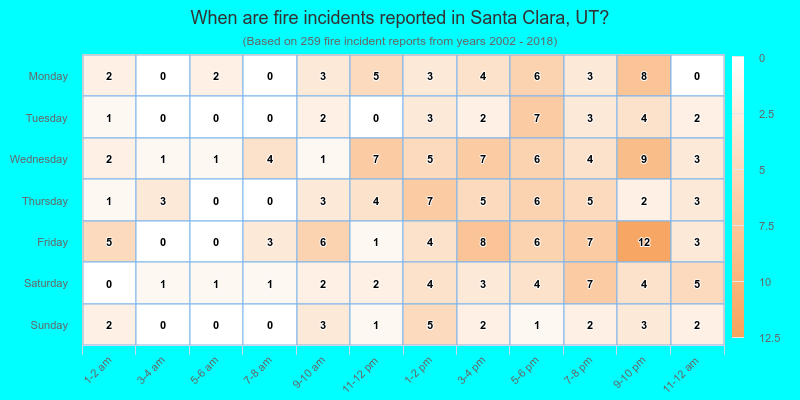
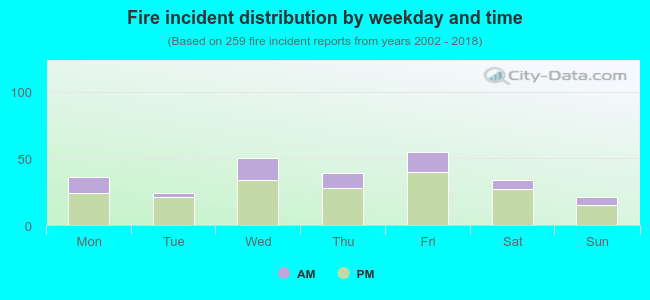 27.0% incidents where reported in the morning and 73.0% in the evening. The most fires (21.2%) took place on Friday, and the least (8.1%) on Sunday.
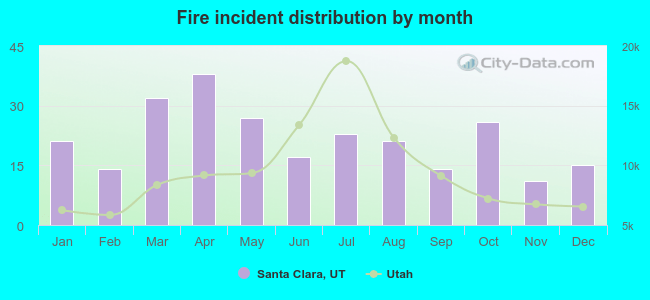 Based on the 259 incident reports from years 2002 - 2018 most fires (14.7%) took place during April, and the least (4.2%) in November.
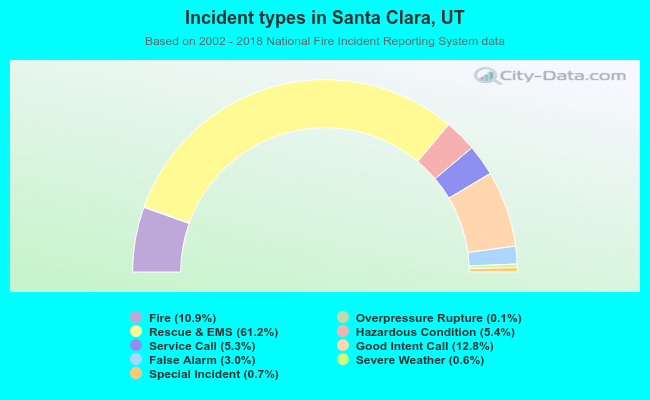 Out of all 2,371 cases reported during the years 2002 - 2018, the most belonged to the categories: Rescue & EMS (61.2%), Good Intent Call (12.8%), and Fire (10.9%).
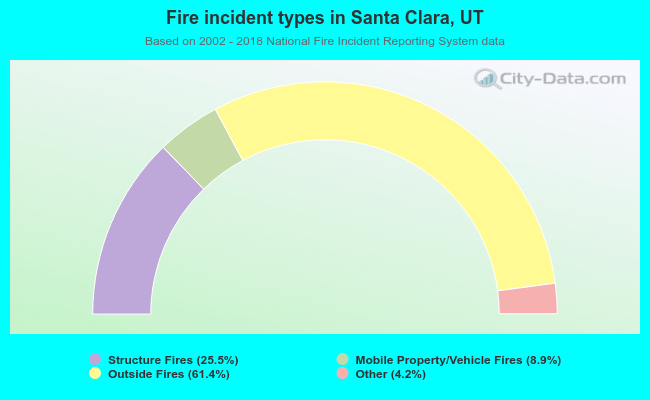 When looking into fire subcategories, the most reports belonged to: Outside Fires (61.4%), and Structure Fires (25.5%).