Sandown: Fire Incidents, New Hampshire (NH)
Where are fire incidents reported in Sandown, NH
Something went wrong! Please refresh the page.
|
| |||||||||||||||||||||||||||||||||||||||||||||||||||||||||||||||||||||||||||||||||||||||||||||||||||||||||||||
| Other | 51 | |||||||||||||||||||||||||||||||||||||||||||||||||||||||||||||||||||||||||||||||||||||||||||||||||||||||||||||
2002 - 2018 National Fire Incident Reporting System (NFIRS) incidents
- Incident types reported to NFIRS in Sandown, NH
- 1,21955.6%Rescue & EMS
- 41619.0%Hazardous Condition
- 2179.9%Fire
- 1245.7%Service Call
- 1084.9%False Alarm
- 1044.7%Good Intent Call
- Fire incident types reported to NFIRS in Sandown, NH
- 13763.1%Structure Fires
- 5224.0%Outside Fires
- 177.8%Mobile Property/Vehicle Fires
- 115.1%Other
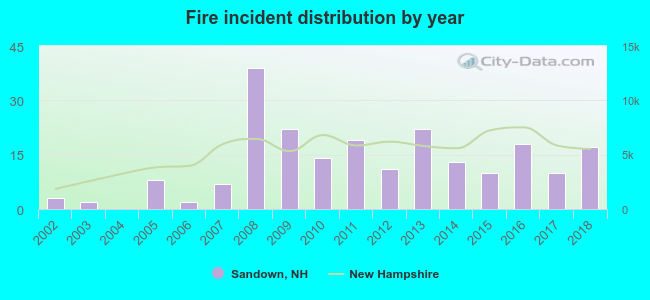 Based on the data from the years 2002 - 2018 the average number of fires per year is 13. The highest number of reported fires - 39 took place in 2008, and the least - 0 in 2004. The data has a rising trend.
The average number of yearly fire incidents per 10k residents in Sandown, NH compared to nearest cities:
(Note: Based on data for the last 3 years, including only cities with population 5,000 and above)
| Sandown: | 25.1 |
| Hampstead: | 26.2 |
| Kingston: | 52.6 |
| Atkinson: | 17.3 |
| Derry: | 46.6 |
| Plaistow: | 47.3 |
| Salem: | 38.0 |
| Londonderry: | 72.8 |
| Windham: | 29.7 |
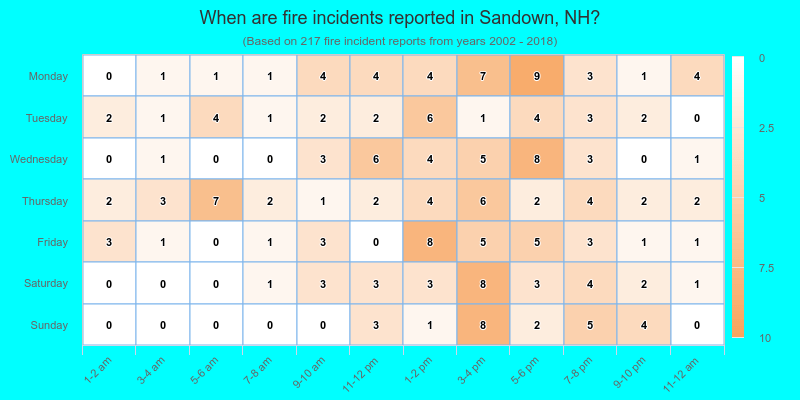
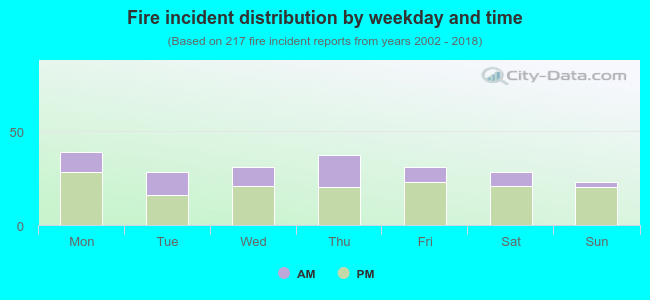 31.3% incidents where reported in the morning and 68.7% in the evening. The most fires (18.0%) took place on Monday, and the least (10.6%) on Sunday.
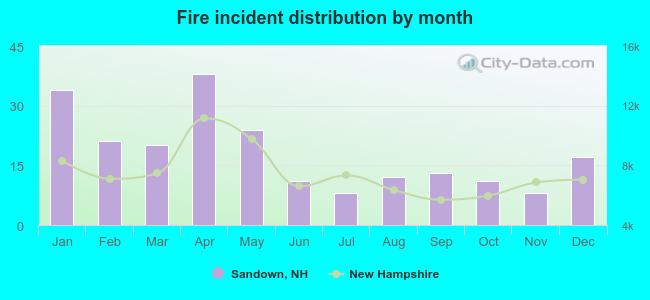 Based on the 217 fire incident reports from years 2002 - 2018 most fires (17.5%) took place during April, and the least (3.7%) in July.
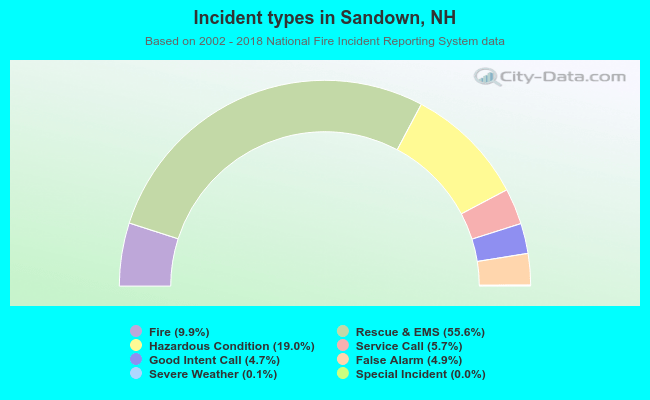 Out of all 2,191 cases reported during the years 2002 - 2018, the most belonged to the categories: Overpressure Rupture (55.6%), Rescue & EMS (19.0%), and Fire (9.9%).
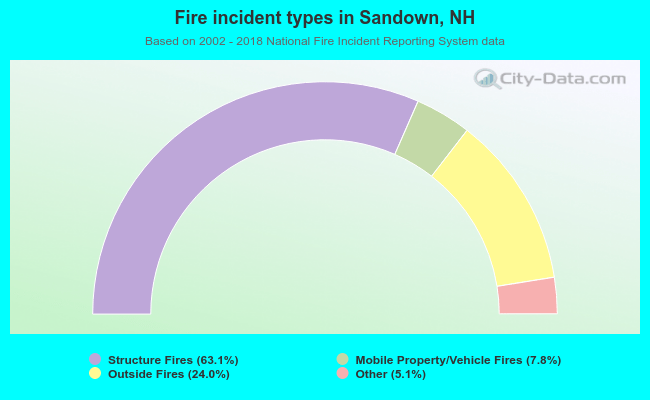 When looking into fire subcategories, the most reports belonged to: Structure Fires (63.1%), and Outside Fires (24.0%).