Sand Lake: Fire Incidents, Michigan (MI)
Where are fire incidents reported in Sand Lake, MI
Something went wrong! Please refresh the page.
|
| |||||||||||||||||||||||||||||||||||||||||||||||||||||||||||||||||||||||||||||||||||||||||||||||||||||||||||||
2002 - 2018 National Fire Incident Reporting System (NFIRS) incidents
- Incident types reported to NFIRS in Sand Lake, MI
- 39432.1%Rescue & EMS
- 38030.9%Fire
- 23018.7%Hazardous Condition
- 1119.0%Service Call
- 856.9%Good Intent Call
- 252.0%False Alarm
- 20.2%Severe Weather
- Fire incident types reported to NFIRS in Sand Lake, MI
- 18247.9%Structure Fires
- 13034.2%Outside Fires
- 5514.5%Mobile Property/Vehicle Fires
- 133.4%Other
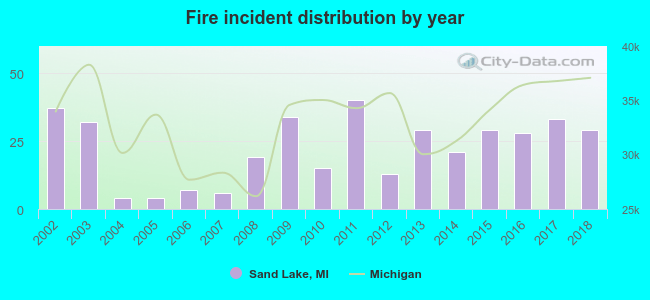 Based on the data from the years 2002 - 2018 the average number of fires per year is 22. The highest number of fire incidents - 40 took place in 2011, and the least - 4 in 2004. The data has a declining trend.
 According to the reports from the years 2002 - 2018 the average number of fire-related yearly casualties is 0. The highest number of casualties - 1 took place in 2008, and the lowest - 0 in 2002. The data has a constant trend.
 29.7% incidents where reported in the morning and 70.3% in the evening. The most fires (16.8%) took place on Friday, and the least (12.4%) on Sunday.
 According to the 380 fire incidents from years 2002 - 2018 most fires (14.5%) took place during July, and the least (3.7%) in October.
 Out of all 1,228 cases reported during the years 2002 - 2018, the most belonged to the categories: Overpressure Rupture (32.1%), Fire (30.9%), and Rescue & EMS (18.7%).
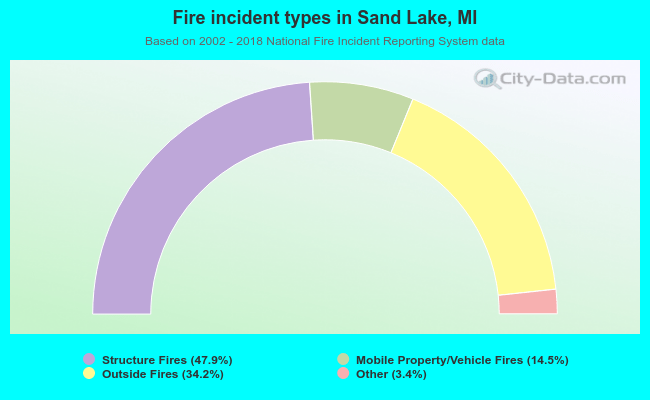 When looking into fire subcategories, the most incidents belonged to: Structure Fires (47.9%), and Outside Fires (34.2%).