San Juan Bautista: Fire Incidents, California (CA)
Where are fire incidents reported in San Juan Bautista, CA
Something went wrong! Please refresh the page.
|
| |||||||||||||||||||||||||||||||||||||||||||||||||||||||||||||||||||||||||||||||||||||||||||||||||||||||||||||
2005 - 2018 National Fire Incident Reporting System (NFIRS) incidents
- Incident types reported to NFIRS in San Juan Bautista, CA
- 45842.8%Rescue & EMS
- 18217.0%Service Call
- 15314.3%Fire
- 13012.2%Good Intent Call
- 716.6%Hazardous Condition
- 716.6%False Alarm
- 30.3%Special Incident
- Fire incident types reported to NFIRS in San Juan Bautista, CA
- 7146.4%Outside Fires
- 3623.5%Structure Fires
- 2919.0%Mobile Property/Vehicle Fires
- 1711.1%Other
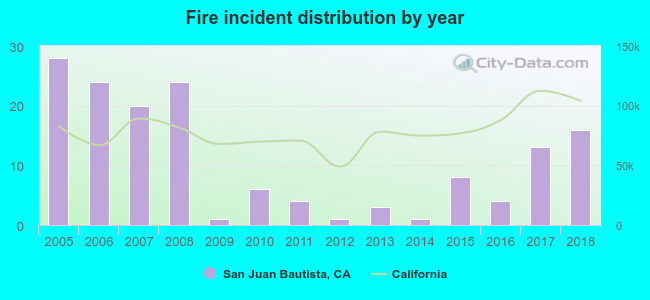 Based on the data from the years 2005 - 2018 the average number of fires per year is 11. The highest number of reported fire incidents - 28 took place in 2005, and the least - 1 in 2009. The data has a decreasing trend.
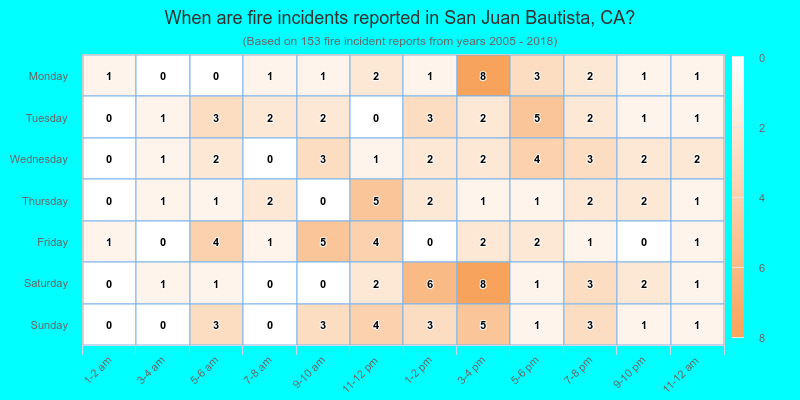
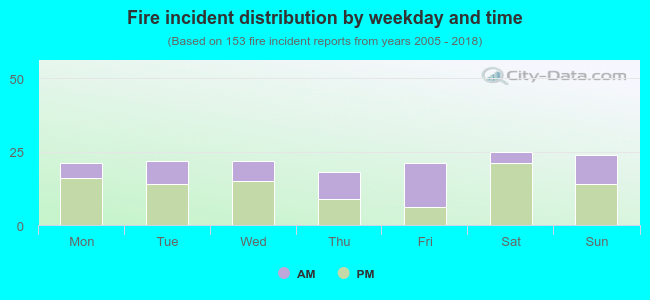 37.9% incidents where reported in the morning and 62.1% in the evening. The most fires (16.3%) took place on Saturday, and the least (11.8%) on Thursday.
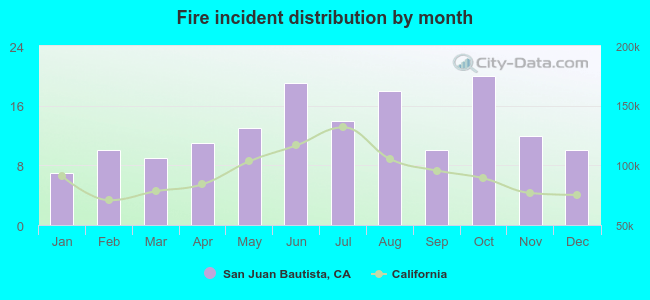 Based on the 153 fire incident reports from years 2005 - 2018 most fires (13.1%) took place during October, and the least (4.6%) in January.
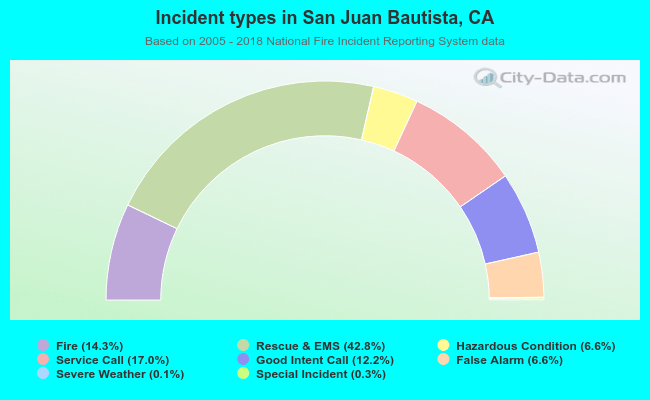 Out of all 1,069 cases reported during the years 2005 - 2018, the most belonged to the categories: Overpressure Rupture (42.8%), Hazardous Condition (17.0%), and Fire (14.3%).
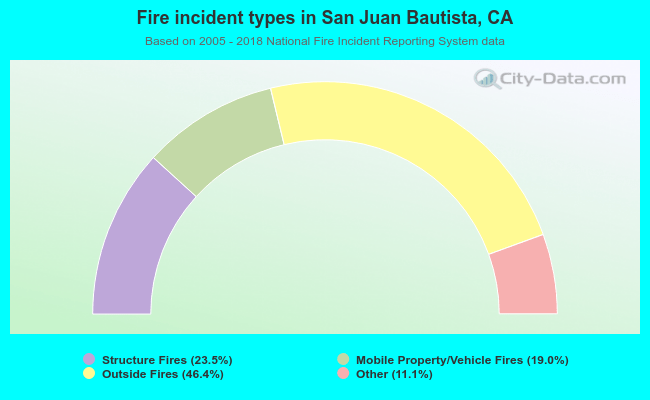 When looking into fire subcategories, the most incidents belonged to: Outside Fires (46.4%), and Structure Fires (23.5%).