| Fire incidents reported |
|---|
| Sreet name | Count |
|---|
| INTERSTATE 40 | 36 | | I-40 FWY | 18 | | I-40 | 16 | | I40 | 12 | | STATE HWY 469 | 8 | | MAIN | 6 | | QUAY ROAD 64 | 6 | | QUAY ROAD U | 6 | | STATE HIGHWAY 469 | 6 | | STATE RD 469 | 6 | | STATE ROAD 469 | 6 | | 10TH STREET | 4 | | 469 HWY | 4 | | 5TH ST | 4 | | INTERSTATE 40 FWY | 4 | | QUAY ROAD 70 | 4 | | ROUTE 66 | 4 | | 1 MILE NORTH OF QUAY ROAD 51 | 2 | | 121 S 10TH STREET | 2 | | 1695 QR 65 RD | 2 | | 1815 CEMETARY RD ROAD | 2 | | 1815 CEMETERY RD. | 2 | | 1815 CEMETERY ROAD | 2 | | 1939 QUAY RD 65 | 2 | | 2405 STATE HIWAY 469 HWY | 2 |
| | | Fire incidents reported |
|---|
| Sreet name | Count |
|---|
| 2784 STSTE HWY 469 | 2 | | 289 SH 392 | 2 | | 289 STATE HIGHWAY 392 | 2 | | 354 MM I40 | 2 | | 422 N. 5TH | 2 | | 469 MM 25 | 2 | | 469 MM32 | 2 | | 5 MILES NE OF SAN JON | 2 | | 502 5TH ST. | 2 | | 6397 QR T | 2 | | 6513 QR P | 2 | | 715 E MAIN STREET | 2 | | CEMETARY ROAD AND HIGHWAY 469 | 2 | | CEMETARY ROAD VLG | 2 | | EAST OF 469 ON QUAY ROAD 65 | 2 | | FROST RANCH | 2 | | GIBSON 11-40800807X | 2 | | HGHWAY 54 FWY | 2 | | HIGHWAY 469 | 2 | | HIGHWAY 469 HWY | 2 | | HWY 469 AND QR 64 | 2 | | I -40 WEST BOUND | 2 | | I -40 MILE MARKER 358 | 2 | | I-40 353 MILE MARKER | 2 | | |
|
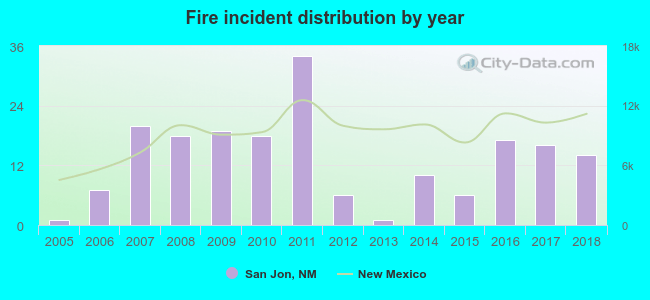 Based on the data from the years 2005 - 2018 the average number of fires per year is 13. The highest number of fires - 34 took place in 2011, and the least - 1 in 2005. The data has a growing trend.
 24.1% incidents where reported in the morning and 75.9% in the evening. The most fires (21.9%) took place on Sunday, and the least (8.6%) on Tuesday.
 According to the 187 fire incidents from years 2005 - 2018 most fires (15.0%) took place during March, and the least (2.1%) in September.
 Out of all 223 cases reported during the years 2005 - 2018, the most belonged to the categories: Fire (83.9%), Overpressure Rupture (9.0%), and Hazardous Condition (4.9%).
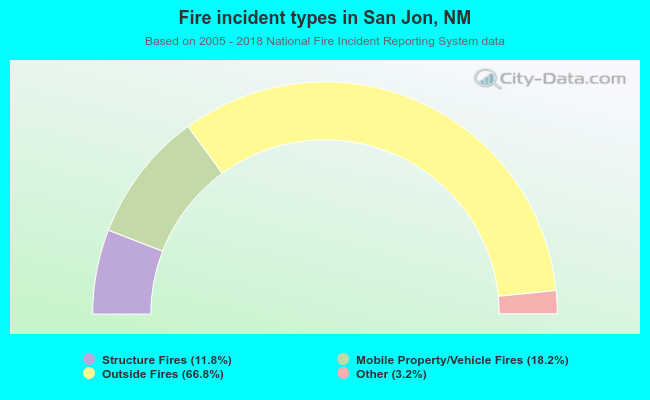 When looking into fire subcategories, the most incidents belonged to: Outside Fires (66.8%), and Mobile Property/Vehicle Fires (18.2%).