Sabin: Fire Incidents, Minnesota (MN)
Where are fire incidents reported in Sabin, MN
Something went wrong! Please refresh the page.
|
| |||||||||||||||||||||||||||||||||||||||||||||||||||||||||||||||||||||||||||||||||||||||||||||||||||||||||||||
| Other | 18 | |||||||||||||||||||||||||||||||||||||||||||||||||||||||||||||||||||||||||||||||||||||||||||||||||||||||||||||
2002 - 2018 National Fire Incident Reporting System (NFIRS) incidents
- Incident types reported to NFIRS in Sabin, MN
- 15845.1%Fire
- 12435.4%Rescue & EMS
- 329.1%Good Intent Call
- 267.4%Hazardous Condition
- 41.1%Service Call
- 41.1%False Alarm
- 20.6%Special Incident
- Fire incident types reported to NFIRS in Sabin, MN
- 9057.0%Outside Fires
- 4125.9%Structure Fires
- 2314.6%Mobile Property/Vehicle Fires
- 42.5%Other
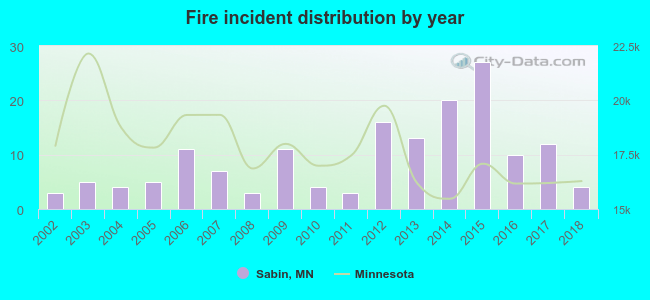 According to the data from the years 2002 - 2018 the average number of fires per year is 9. The highest number of fires - 27 took place in 2015, and the least - 3 in 2002. The data has a rising trend.
 22.8% incidents where reported in the morning and 77.2% in the evening. The most fires (17.7%) took place on Sunday, and the least (6.3%) on Wednesday.
 According to the 158 reports from years 2002 - 2018 most fires (20.9%) took place during April, and the least (2.5%) in March.
 Out of all 350 cases reported during the years 2002 - 2018, the most belonged to the categories: Fire (45.1%), Overpressure Rupture (35.4%), and Service Call (9.1%).
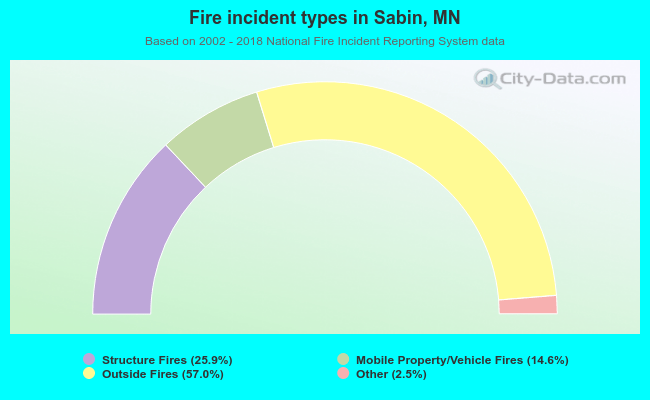 When looking into fire subcategories, the most reports belonged to: Outside Fires (57.0%), and Structure Fires (25.9%).