| Fire incidents reported |
|---|
| Sreet name | Count |
|---|
| MAIN ST | 42 | | STATE ROUTE 124 HWY | 42 | | NEW LIMA RD | 38 | | LEADING CREEK RD | 28 | | HAPPY HOLLOW ROAD | 24 | | HYSELL RUN RD | 20 | | SALEM STREET | 18 | | STATE ROUTE 143 | 18 | | NEW LIMA RD | 16 | | BEECH GROVE RD | 14 | | SALEM ST | 14 | | STATE ROUTE 124 HWY | 12 | | STATE ROUTE 684 | 12 | | BEACH GROVE RD | 10 | | BEECH GROVE RD | 10 | | COUNTY RD 1 | 10 | | PAINTER RIDGE RD | 10 | | PAULINS HILL RD | 10 | | SWICK RD | 10 | | TITUS RD | 10 | | WELLS RD | 10 | | 2ND AVE | 8 | | DEXTER ROAD | 8 | | EDMONDSON RD RD | 8 | | HYSELL RUN RD | 8 |
| | | Fire incidents reported |
|---|
| Sreet name | Count |
|---|
| KINGSBURY RD | 8 | | MULBERRY AVE | 8 | | STATE ROUTE 124 | 8 | | STATE ROUTE 325 | 8 | | STATE ROUTE 7 | 8 | | WHITES HILL RD | 8 | | ZION RD RD | 8 | | BRADBURY RD RD | 6 | | BRIAR RIDGE | 6 | | COTTERILL RD | 6 | | DEPOT ST | 6 | | HAPPY HOLLOW | 6 | | JACKS RD | 6 | | JEFFERS RD RDS | 6 | | LARKIN ST | 6 | | MCCUMBER RD | 6 | | METHENEY RD | 6 | | NICHOLSON HILL RD | 6 | | OLD DEXTER RD | 6 | | RIFE RD | 6 | | SMITH RUN RD | 6 | | SWICK RD | 6 | | VANCE | 6 | | BRIAR RIDGE RD. | 4 | | |
|
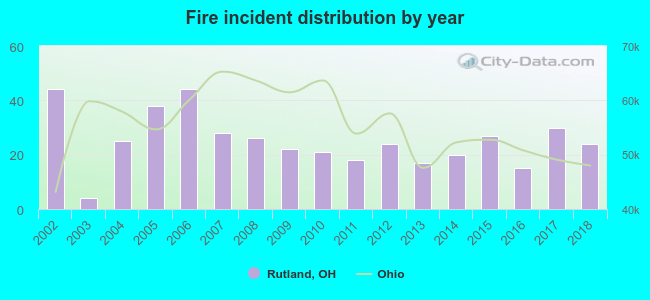 Based on the data from the years 2002 - 2018 the average number of fires per year is 25. The highest number of reported fire incidents - 44 took place in 2002, and the least - 4 in 2003. The data has a dropping trend.
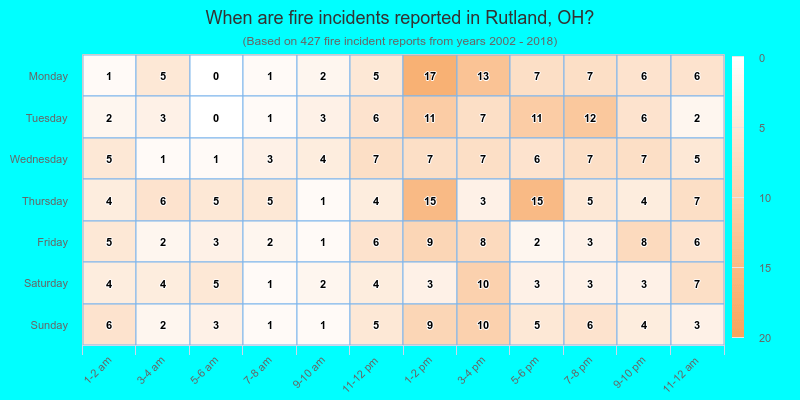
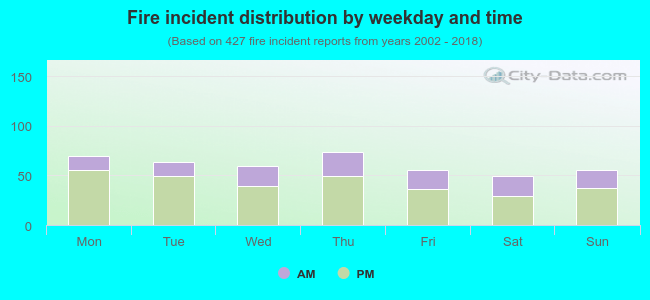 30.9% incidents where reported in the morning and 69.1% in the evening. The most fires (17.3%) took place on Thursday, and the least (11.5%) on Saturday.
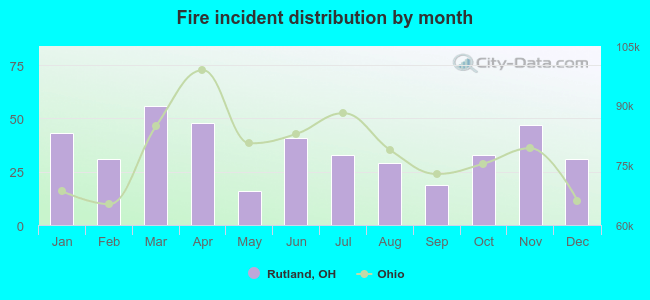 According to the 427 incident reports from years 2002 - 2018 most fires (13.1%) took place during March, and the least (3.7%) in May.
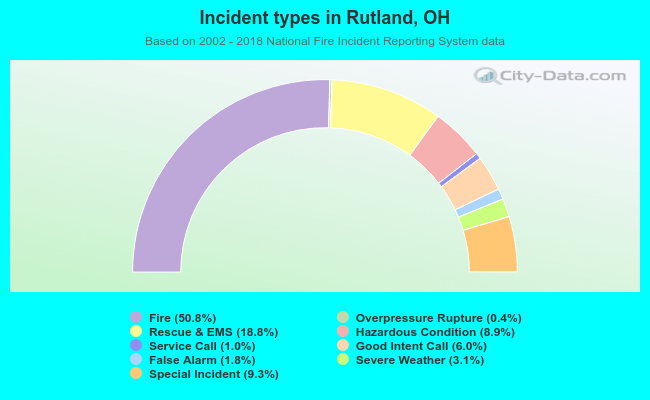 Out of all 840 cases reported during the years 2002 - 2018, the most belonged to the categories: Fire (50.8%), Rescue & EMS (18.8%), and Special Incident (9.3%).
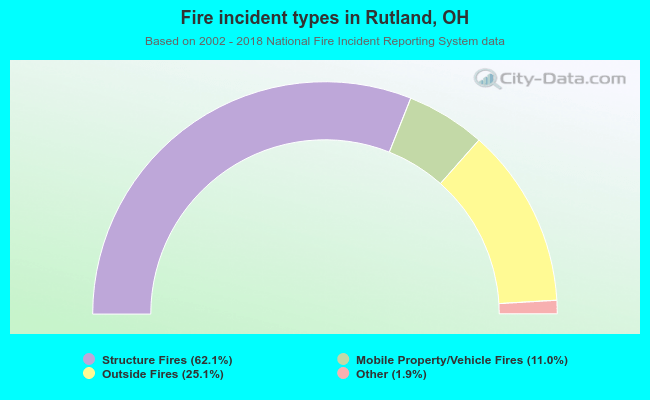 When looking into fire subcategories, the most reports belonged to: Structure Fires (62.1%), and Outside Fires (25.1%).