Rutherfordton: Fire Incidents, North Carolina (NC)
Where are fire incidents reported in Rutherfordton, NC
Something went wrong! Please refresh the page.
|
| |||||||||||||||||||||||||||||||||||||||||||||||||||||||||||||||||||||||||||||||||||||||||||||||||||||||||||||
| Other | 578 | |||||||||||||||||||||||||||||||||||||||||||||||||||||||||||||||||||||||||||||||||||||||||||||||||||||||||||||
2003 - 2018 National Fire Incident Reporting System (NFIRS) incidents
- Incident types reported to NFIRS in Rutherfordton, NC
- 3,17139.3%Rescue & EMS
- 1,87923.3%Hazardous Condition
- 1,47818.3%Fire
- 7249.0%Good Intent Call
- 3644.5%False Alarm
- 3384.2%Service Call
- 881.1%Severe Weather
- 240.3%Special Incident
- Fire incident types reported to NFIRS in Rutherfordton, NC
- 65644.4%Structure Fires
- 56938.5%Outside Fires
- 15110.2%Mobile Property/Vehicle Fires
- 1026.9%Other
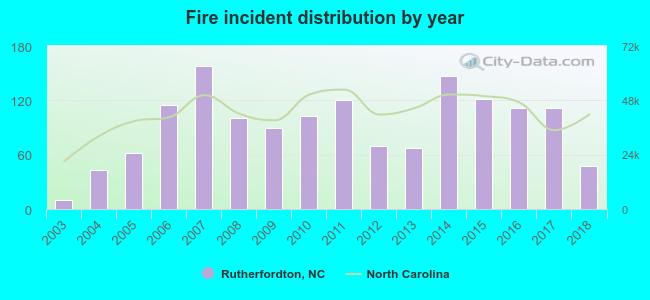 Based on the data from the years 2003 - 2018 the average number of fires per year is 92. The highest number of reported fire incidents - 158 took place in 2007, and the least - 10 in 2003. The data has a growing trend.
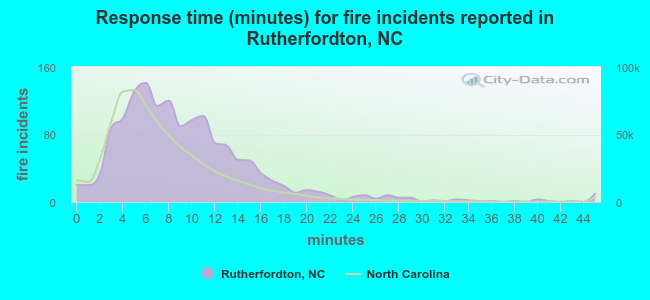 The median response time based on all reported fire incidents is 8 minutes. This is higher compared to the state median value.
The median response time in Rutherfordton, NC compared to nearest cities:
(Note: Based on data for all years, including only cities with at least 500 fire incidents)
| Rutherfordton: | 8 minutes |
| Forest City: | 6 minutes |
| Bostic: | 10 minutes |
| Ellenboro: | 8 minutes |
| Lake Lure: | 10 minutes |
| Mooresboro: | 9 minutes |
| Old Fort: | 11 minutes |
| Marion: | 9 minutes |
| Lawndale: | 8 minutes |
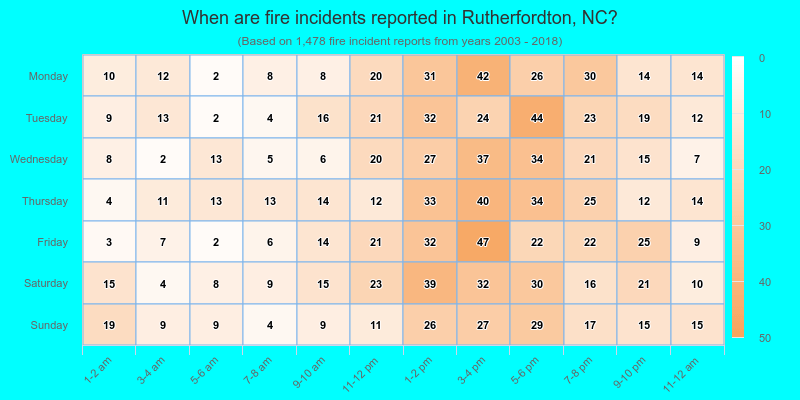
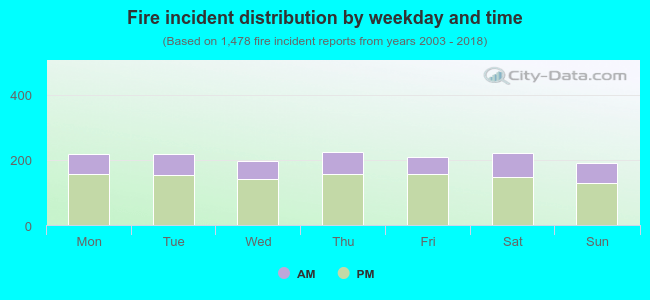 29.4% incidents where reported in the morning and 70.6% in the evening. The most fires (15.2%) took place on Thursday, and the least (12.9%) on Sunday.
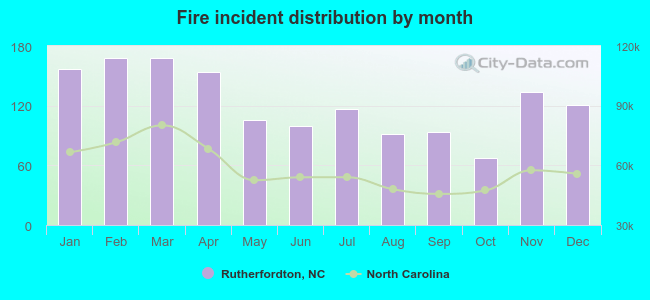 Based on the 1,478 fire incidents from years 2003 - 2018 most fires (11.4%) took place during February, and the least (4.5%) in October.
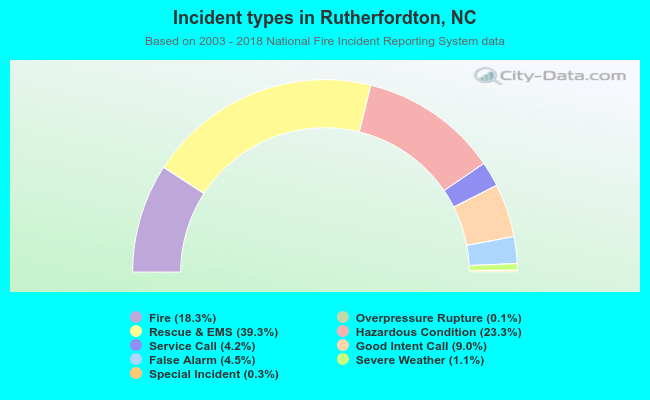 Out of all 8,072 cases reported during the years 2003 - 2018, the most belonged to the categories: Rescue & EMS (39.3%), Hazardous Condition (23.3%), and Fire (18.3%).
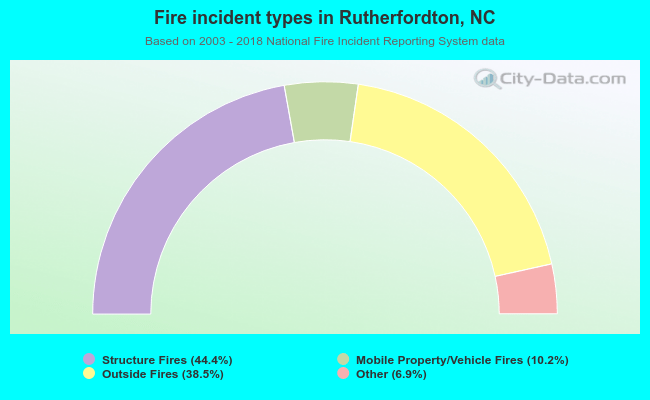 When looking into fire subcategories, the most incidents belonged to: Structure Fires (44.4%), and Outside Fires (38.5%).