| Fire incidents reported |
|---|
| Sreet name | Count |
|---|
| HUNTINGTON RD | 40 | | WESTFIELD RD | 34 | | GENERAL KNOX RD | 28 | | RIVER ST | 26 | | BLANDFORD RD | 24 | | MAIN ST | 22 | | QUARTER RD | 22 | | NOBLE VIEW LN | 18 | | SOUTH QUARTER RD | 18 | | WORONOCO RD | 16 | | MASS TPKE | 12 | | PINE HILL RD | 12 | | VALLEY VIEW AVE | 12 | | BRIDGE ST | 10 | | DICKINSON HILL RD | 10 | | ROUTE 20 | 10 | | BLANDFORD RD. | 8 | | HUNTINGTON RD | 8 | | RIVER ST | 8 | | WOODLAND WAY | 8 | | MT. LAUREL DR | 6 | | OLD WESTFIELD RD | 6 | | TIMBERIDGE DR | 6 | | 110 GENERAL KNOX RD | 4 | | BLANDFORD STAGE RD | 4 |
| | | Fire incidents reported |
|---|
| Sreet name | Count |
|---|
| DICKENSON HILL RD | 4 | | FAIRVIEW AVE | 4 | | FROG HOLLOW RD | 4 | | HIGHLAND AVE | 4 | | HOMESTEAD AVE | 4 | | HUNTINGTON RD. | 4 | | OLD QUARTER RD | 4 | | ROUTE 23 | 4 | | RT 20 | 4 | | STATION RD | 4 | | TEKOA AVE | 4 | | VALLEY VIEW DR | 4 | | WEST MAIN ST | 4 | | WESTFIELD RD. | 4 | | 103 DICKISON HILL RD | 2 | | 110 GENERAL KNOX RD. | 2 | | 1124 HUNTINGTON RD | 2 | | 20 BRIDGE ST | 2 | | A LISTED IN NARRATIVE | 2 | | ALLEN COIT RD | 2 | | BIRCHWOOD TR | 2 | | BLANDFORD HILL RD | 2 | | BLANDFORD RD RD | 2 | | BLANDFORD ROAD | 2 | | |
|
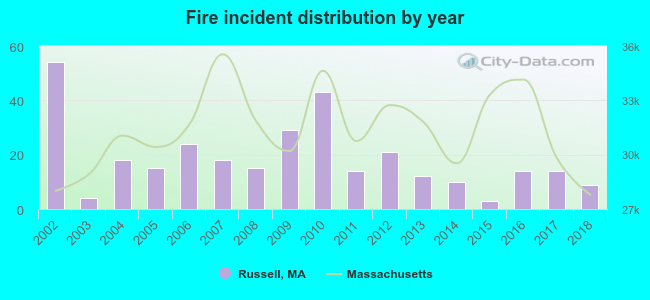 Based on the data from the years 2002 - 2018 the average number of fires per year is 19. The highest number of fires - 54 took place in 2002, and the least - 3 in 2015. The data has a declining trend.
 40.1% incidents where reported in the morning and 59.9% in the evening. The most fires (18.0%) took place on Wednesday, and the least (11.0%) on Tuesday.
 Based on the 317 fire incidents from years 2002 - 2018 most fires (18.6%) took place during April, and the least (2.2%) in October.
 Out of all 1,034 cases reported during the years 2002 - 2018, the most belonged to the categories: Overpressure Rupture (31.7%), Fire (30.7%), and Rescue & EMS (18.5%).
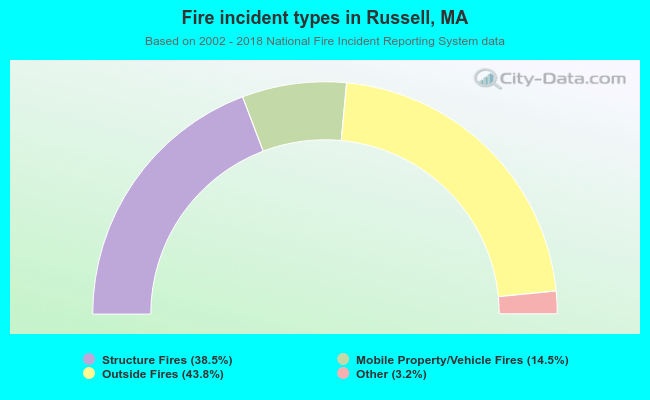 When looking into fire subcategories, the most reports belonged to: Outside Fires (43.8%), and Structure Fires (38.5%).