| Fire incidents reported |
|---|
| Sreet name | Count |
|---|
| CR 1700 | 28 | | CR 3701 | 24 | | HIDEAWAY BAY | 20 | | HWY 380 | 16 | | MEADOW POND CT | 14 | | 110 PR 1509 | 12 | | JO CASTLEBERRY RD | 12 | | RUNAWAY BAY DR | 12 | | SHADY OAKS | 12 | | W HWY 380 | 12 | | CR 3701 JL CASTLEBERRY | 10 | | BOY SCOUT RANCH RD | 8 | | JL CASTLEBERRY RD | 8 | | SHADY OAKS DR | 8 | | SHADY OAKS DR | 8 | | BEHIND SEWAGE PLANT | 6 | | JACK COUNTY & 380 | 6 | | PORT O CALL | 6 | | RUNAWAY BAY DR | 6 | | 000 HWY 380 | 4 | | 110 LAKEVIEW | 4 | | 11009 SHADY OAKS DR | 4 | | 122 SYCAMORE | 4 | | 201 RATLIFF | 4 | | 210 HASTINGS | 4 |
| | | Fire incidents reported |
|---|
| Sreet name | Count |
|---|
| 279 PR 3501 | 4 | | 627 LANAI CIRCLE | 4 | | BAY LANDING | 4 | | BOY SCOUT RANCH | 4 | | BOY SCOUT RANCH RD. | 4 | | BRIDGE AT HWY 380 | 4 | | ELM CT | 4 | | EXIT 9 BY POOL | 4 | | FLOZELL ADAMS DR | 4 | | HALFMOON WAY | 4 | | HARBOR INN | 4 | | HIGHWAY 380 | 4 | | HWY 380 EAST OF BRIDGE | 4 | | LAKESHORE DR | 4 | | MEADOW POND COUR | 4 | | ONE STOP OF TX | 4 | | PR 1509 | 4 | | RUNAWAY BAY | 4 | | RUNAWAY BAY GOLF COURSE | 4 | | SHADY ACRES | 4 | | SHADY OAKS DRIVE | 4 | | US 380 E OF BRIDGE | 4 | | US HWY 380 | 4 | | W US HWY 380 | 4 | | |
|
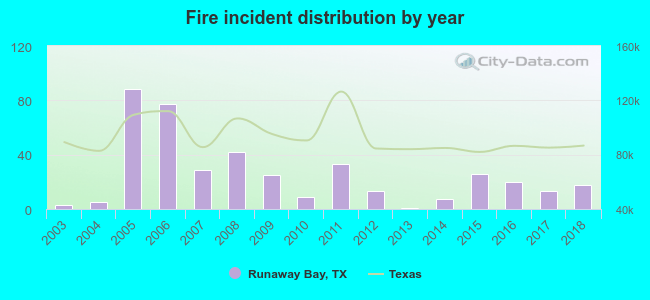 Based on the data from the years 2003 - 2018 the average number of fires per year is 26. The highest number of reported fires - 88 took place in 2005, and the least - 1 in 2013. The data has a growing trend.
 20.3% incidents where reported in the morning and 79.7% in the evening. The most fires (18.3%) took place on Saturday, and the least (9.3%) on Friday.
 According to the 409 reports from years 2003 - 2018 most fires (14.2%) took place during July, and the least (4.2%) in April.
 Out of all 1,087 cases reported during the years 2003 - 2018, the most belonged to the categories: Fire (37.6%), Rescue & EMS (36.7%), and Service Call (8.6%).
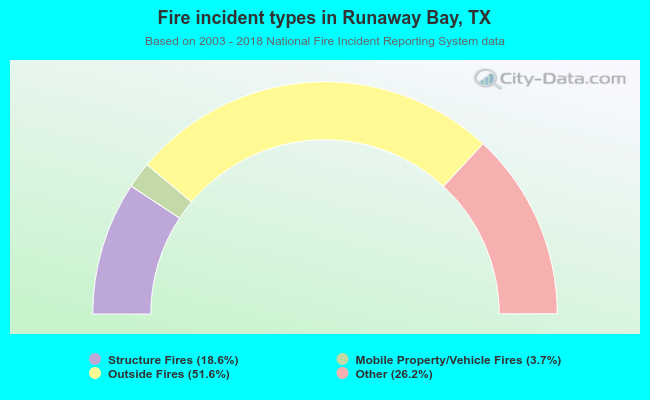 When looking into fire subcategories, the most incidents belonged to: Outside Fires (51.6%), and Other (26.2%).