| Fire incidents reported |
|---|
| Sreet name | Count |
|---|
| HWY 265 | 8 | | HWY 9 | 8 | | BAILEY SAW MILL ROAD | 6 | | 142 DEESE CIRCLE | 4 | | 226 BAILEY SAW MILL RD | 4 | | 3502 WEXFORD ROAD | 4 | | 502 WAGON WHEEL RD | 4 | | 593 HWY 265 | 4 | | 809 POPULAR RD | 4 | | ANGELUS RD | 4 | | POPLAR RD | 4 | | RAMBLING ROAD | 4 | | WOODWARD MILL RD RD | 4 | | WOODWARD MILL ROAD | 4 | | 1007 WOODWARD MILL RD | 2 | | 101 ROSCOE LANE | 2 | | 1012 BAILEY SAW MILL RD | 2 | | 102 W MAIN STREET | 2 | | 1020 ROCK SPRINGS CHURCH RD | 2 | | 104 JAKE GULLEDGE LANE | 2 | | 1042 BART THURMAN ROAD | 2 | | 1060 CURTIS LEE MILL RD | 2 | | 1060 CURTIS LEE MILLS RD | 2 | | 109 SOUTH | 2 | | 1130 RAMBLING ROAD | 2 |
| | | Fire incidents reported |
|---|
| Sreet name | Count |
|---|
| 1138 RAMBLING ROAD | 2 | | 114 MARKET STREET | 2 | | 1152 BAILEY SAW MILL ROAD | 2 | | 118 HUNTLEY DRIVE | 2 | | 119 ARCHIE SOWELL RD | 2 | | 121 FAIRVIEW CHURCH RD | 2 | | 1212 HWY 265 | 2 | | 13 MAPLE LANE | 2 | | 131 SWEET HOME CHURCH RD | 2 | | 135 BITTLE ROAD | 2 | | 135 BUDDY SELLERS RD | 2 | | 1368 DW OLIVER ROAD | 2 | | 1371 D W OLIVER RD | 2 | | 139 ROCK SPRINGS CHURCH RD | 2 | | 141 ETHEL LANE | 2 | | 142 ETHEL LANE | 2 | | 147 TAYLOR LOOP | 2 | | 1534 BAILEY SAW MILL ROAD | 2 | | 1545 ST. JOHNS CHURCH ROAD | 2 | | 1552 BAILEY SAW MILL RD | 2 | | 157 SHORT EASON ROAD | 2 | | 1624 DW OLIVER RD | 2 | | 163 WOODERS MILL RD | 2 | | 163 WOODWARD MILL RD | 2 | | 1638 BAILEY SAW MILL ROAD | 2 |
|
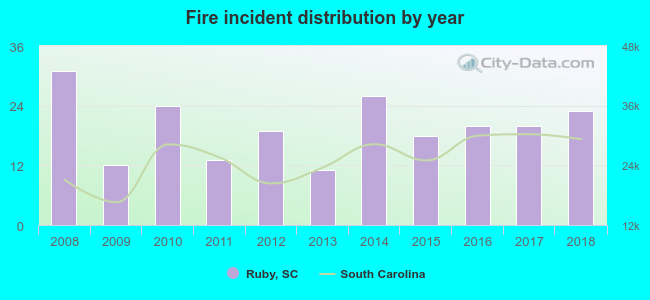 According to the data from the years 2008 - 2018 the average number of fire incidents per year is 20. The highest number of reported fires - 31 took place in 2008, and the least - 11 in 2013. The data has a decreasing trend.
 According to the data from the years 2008 - 2018 the average number of fire-related yearly casualties is 0. The highest number of casualties - 2 took place in 2018, and the lowest - 0 in 2008. The data has an increasing trend.
 27.2% incidents where reported in the morning and 72.8% in the evening. The most fires (20.7%) took place on Thursday, and the least (11.1%) on Sunday.
 Based on the 217 fire incident reports from years 2008 - 2018 most fires (17.1%) took place during March, and the least (4.6%) in September.
 Out of all 293 cases reported during the years 2008 - 2018, the most belonged to the categories: Fire (74.1%), Overpressure Rupture (10.6%), and Service Call (8.5%).
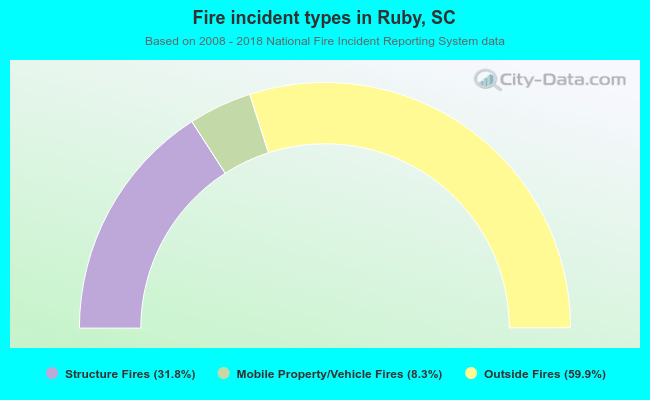 When looking into fire subcategories, the most reports belonged to: Outside Fires (59.9%), and Structure Fires (31.8%).