| Fire incidents reported |
|---|
| Sreet name | Count |
|---|
| CHICAGO | 14 | | ATTICA ST | 12 | | ANN ST | 8 | | CHICAGO ST | 8 | | 205 ANN | 6 | | 3200N 1450E | 6 | | CREATIVE WAY WAY | 6 | | HENDERSON | 6 | | 1280E | 4 | | 19300E 3750N | 4 | | 33627N 1700E | 4 | | 3550 N RD | 4 | | ATTICA | 4 | | CREATIVE WAY | 4 | | GILBERT | 4 | | MAPLE | 4 | | MCKIBBEN | 4 | | STATE ROUTE 1 | 4 | | 100 STUFFLEBEAM | 2 | | 10572E 3550N | 2 | | 106 PERRY | 2 | | 108 STEWART ST | 2 | | 1090E 3550N | 2 | | 110 CREATIVE WAY | 2 | | 110 GILBERT ST | 2 |
| | | Fire incidents reported |
|---|
| Sreet name | Count |
|---|
| 112S CHICAGO ST | 2 | | 114 S CHICAGO ST | 2 | | 12209E 3400N | 2 | | 123W ATTICA | 2 | | 123W ATTICA ST | 2 | | 125 W ATTICA | 2 | | 129S CHICAGO | 2 | | 1300E 3550N | 2 | | 13039E 3550N | 2 | | 135 ATTICA | 2 | | 137 EAST ATTICA | 2 | | 13937E 3680N RD | 2 | | 13947E 3797N | 2 | | 14386E 3550N | 2 | | 14500E 3550N | 2 | | 1500E MANNS CHAPEL | 2 | | 1550E 3800N | 2 | | 15824 MANNS CHAPEL RD | 2 | | 15939 MANNS CHAPEL RD | 2 | | 1650E AND ATTICA RD | 2 | | 1700 E MANNS CHAPEL | 2 | | 1700 E. ROAD | 2 | | 1700E | 2 | | 1750 EAST RD. | 2 | | |
|
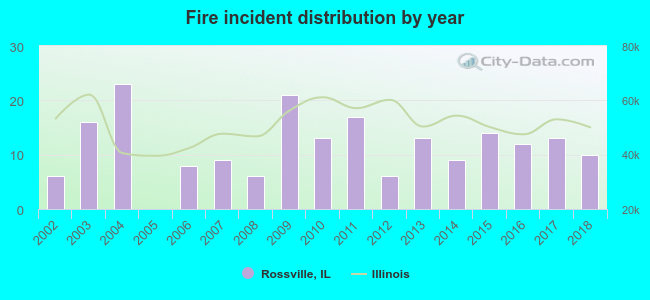 Based on the data from the years 2002 - 2018 the average number of fires per year is 12. The highest number of reported fire incidents - 23 took place in 2004, and the least - 0 in 2005. The data has an increasing trend.
 31.1% incidents where reported in the morning and 68.9% in the evening. The most fires (17.3%) took place on Friday, and the least (10.7%) on Wednesday.
 Based on the 196 incident reports from years 2002 - 2018 most fires (11.7%) took place during March, and the least (3.6%) in July.
 Out of all 313 cases reported during the years 2002 - 2018, the most belonged to the categories: Fire (62.6%), Rescue & EMS (18.2%), and Hazardous Condition (7.0%).
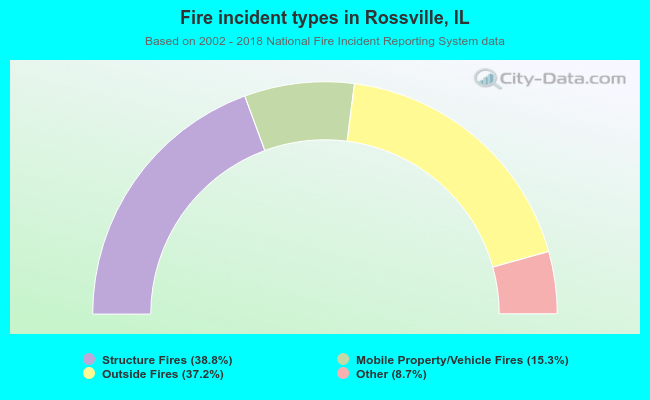 When looking into fire subcategories, the most incidents belonged to: Structure Fires (38.8%), and Outside Fires (37.2%).